Monitoring Azure Databricks with Azure Monitor
Azure Databricks provides comprehensive end-to-end diagnostic logs of activities performed by Azure Databricks users, allowing your enterprise to monitor detailed Azure Databricks usage patterns.
In this article, we’re going to look at sending the logs of Azure Databricks workspace to log analytics workspace using diagnostics settings present in the Databricks workspace.
Here are the pre-requisites and steps to enable diagnostics setting for Azure Databricks
Pre-requisites:
- User with owner or contributor access where the Databricks workspace is deployed.
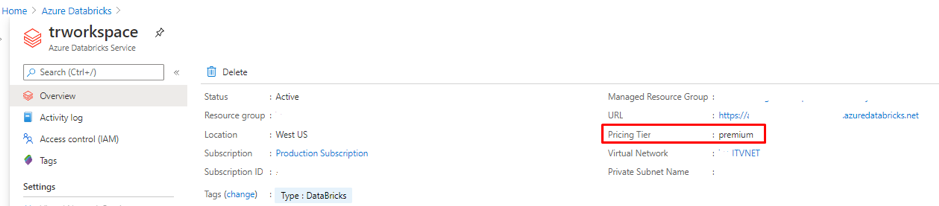
- Databricks workspace. The diagnostics logging for Azure Databricks service is available only for the Premium plan.
Steps:
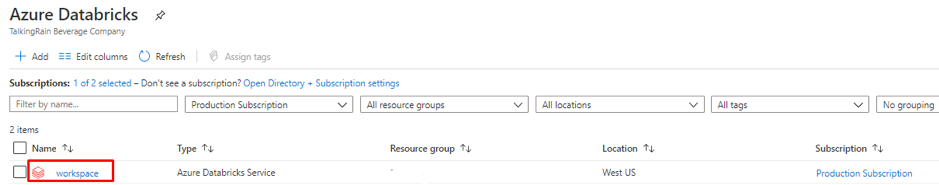
- Login to Azure portal.
- Select the Databricks workspace.
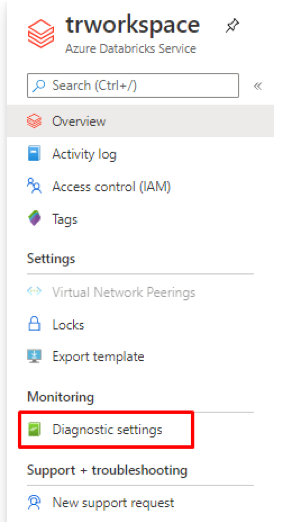
3. Select the diagnostics settings.
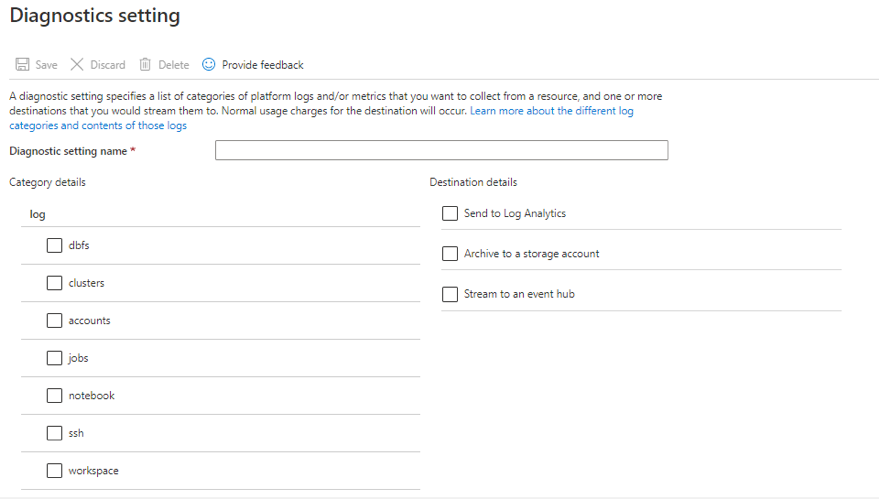
4. Now click “+ Add Diagnostics Settings”.
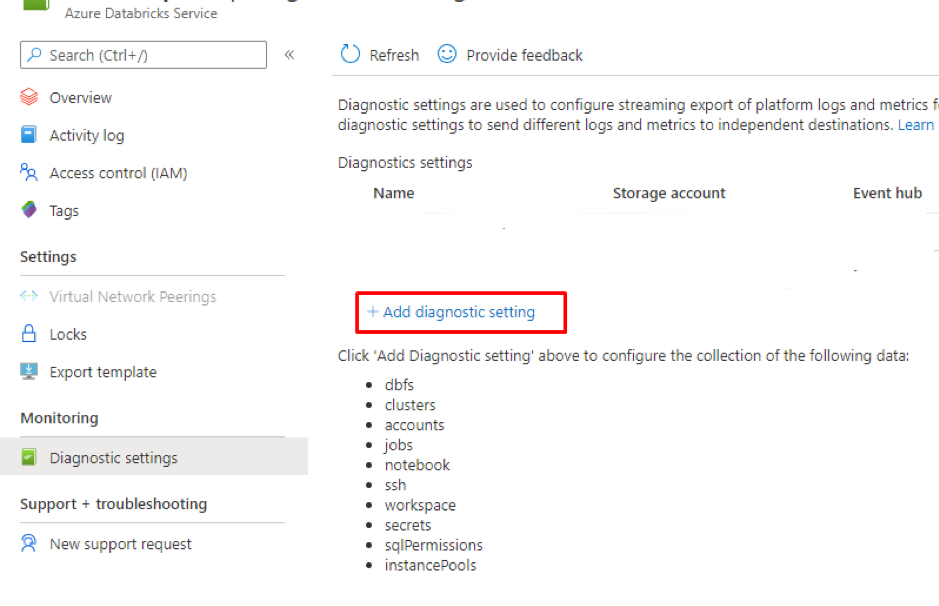
5. Azure Databricks provides diagnostic logs for the following services:
- DBFS
- Clusters
- Pools
- Accounts
- Jobs
- Notebook
- SSH
- Workspace
- Secrets
- SQL Permissions
6. Here we are going to send the logs to the log analytics workspace.
7. Select all the logs you want and send them to log analytics. Here we’re sending cluster logs.
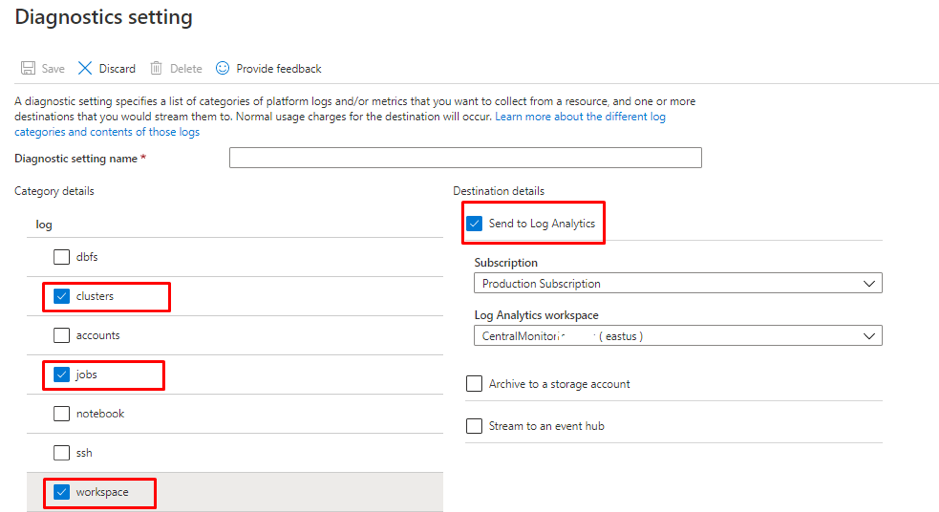
8. Click Save.
9. Allow some time to ingest the logs to log analytics workspace.
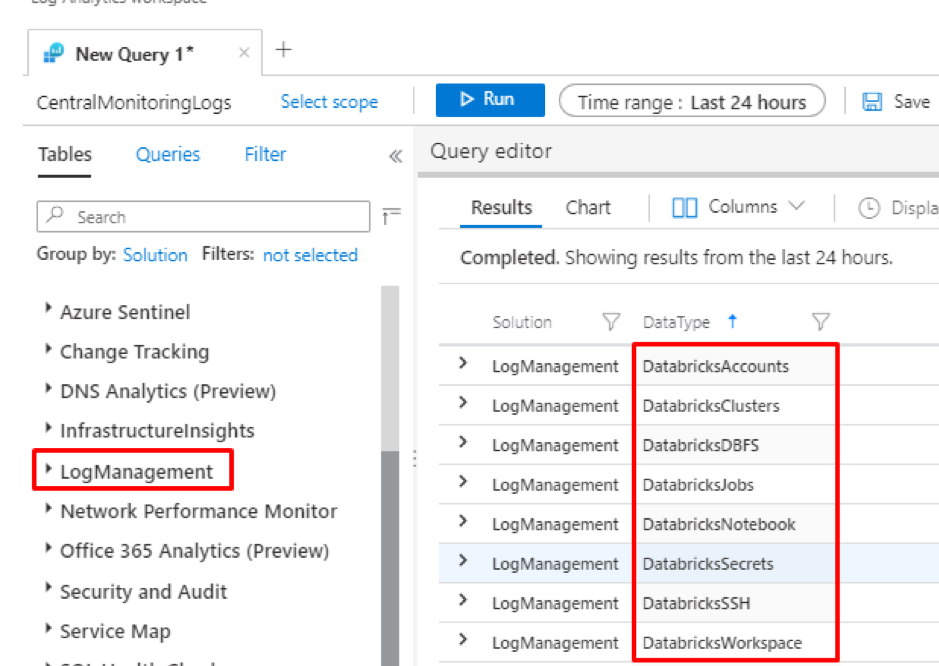
10. Now go to the log analytics workspace where the diagnostics are configured.
11. Select logs. Now using KQL we can query our data sent from the Databricks workspace.
12. The Databricks log tables are found under the LogManagement category.
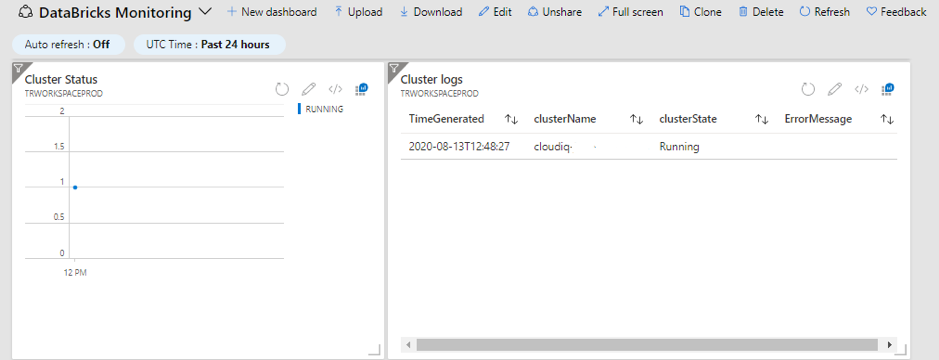
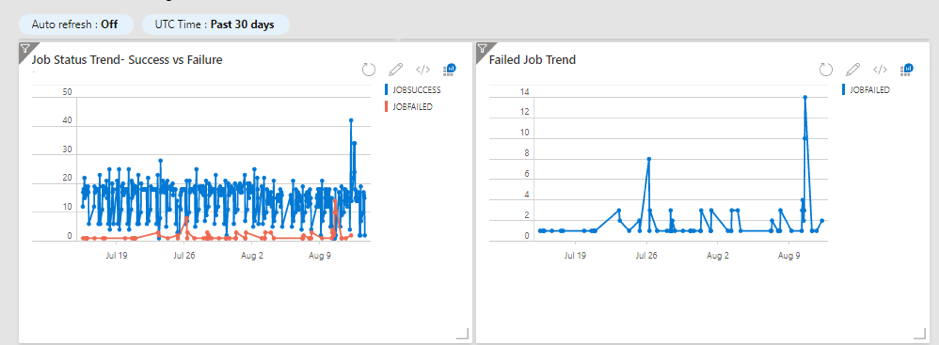
Databricks Monitoring Dashboard
Here is the simple Databricks Monitoring dashboard we created for
- Cluster availability
- Failed job trend
- Success vs failed job trend
We hope this article helps you set up the right configurations to sending the logs of Azure Databricks workspace to log analytics workspace and build the Databricks monitoring dashboard.
Share this:
CloudIQ is a leading Cloud Consulting and Solutions firm that helps businesses solve today’s problems and plan the enterprise of tomorrow by integrating intelligent cloud solutions. We help you leverage the technologies that make your people more productive, your infrastructure more intelligent, and your business more profitable.
LATEST THINKING
INDIA
Chennai One IT SEZ,
Module No:5-C, Phase ll, 2nd Floor, North Block, Pallavaram-Thoraipakkam 200 ft road, Thoraipakkam, Chennai – 600097
© 2023 CloudIQ Technologies. All rights reserved.