How to Monitor Azure Databricks in an Azure Log Analytics Workspace
Azure Databricks lets you spin up clusters and build quickly in a fully managed Apache Spark environment with the global scale and availability of Azure. And of course, for any production-level solution, monitoring is a critical aspect.
Azure Databricks comes with robust monitoring capabilities for custom application metrics, streaming query events, and application log messages. It allows you to push this monitoring data to different logging services.
In this article, we will look at the setup required to send application logs and metrics from Microsoft Azure Databricks to a Log Analytics workspace.
Prerequisites
- Clone the repository mentioned below
https://github.com/mspnp/spark-monitoring.git - Azure Databricks workspace
- Azure Databricks CLI
Databricks workspace personal access token is required to use the CLI
You can also use the Databricks CLI from Azure Cloud Shell. - Java IDEs with the following resources
Java Development Kit (JDK) version 1.8
Scala language SDK 2.11
Apache Maven 3.5.4
Building the Azure Databricks monitoring library with Docker
After cloning repository please open the terminal in the respective path
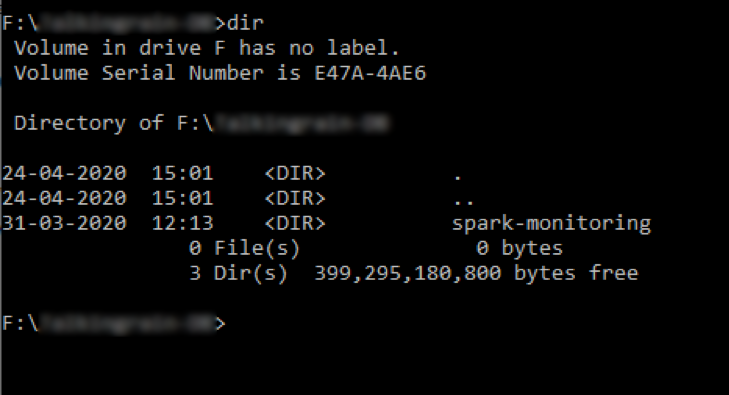
Please run the command as follows
Windows :
docker run -it --rm -v %cd%/spark-monitoring:/spark-monitoring -v "%USERPROFILE%/.m2":/root/.m2 maven:3.6.1-jdk-8 /spark-monitoring/build.sh
Linux:
chmod +x spark-monitoring/build.sh
docker run -it --rm -v `pwd`/spark-monitoring:/spark-monitoring -v "$HOME/.m2":/root/.m2 maven:3.6.1-jdk-8 /spark-monitoring/build.sh
Configuring Databricks workspace
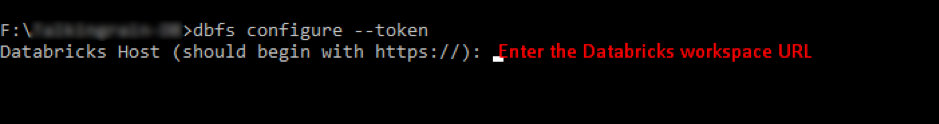
dbfs configure –token
It will ask for Databricks workspace URL and Token
Use the personal access token that was generated when setting up the prerequisites
You can get the URL from
Azure portal > Databricks service > Overview
dbfs mkdirs dbfs:/databricks/spark-monitoring
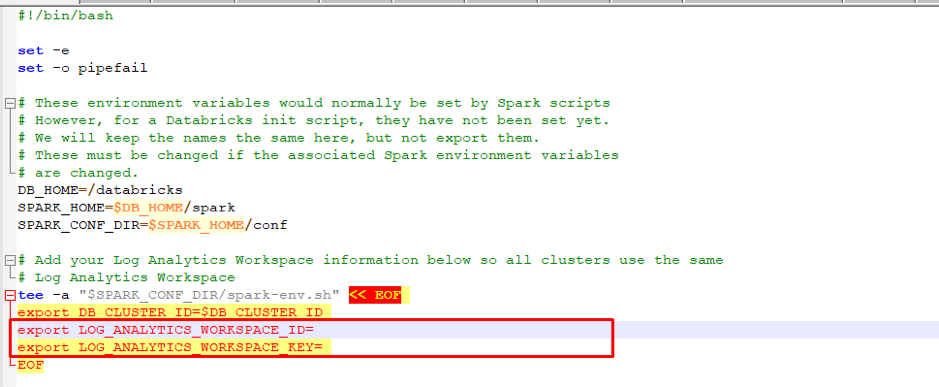
Open the file /src/spark-listeners/scripts/spark-monitoring.sh
Now add the Log Analytics Workspace ID and Key
Use Databricks CLI to copy the modified script
dbfs cp <local path to spark-monitoring.sh> dbfs:/databricks/spark-monitoring/spark-monitoring.sh
Use Databricks CLI to copy all JAR files generated
dbfs cp --overwrite --recursive <local path to target folder> dbfs:/databricks/spark-monitoring/
Create and configure the Azure Databricks cluster
- Navigate to your Azure Databricks workspace in the Azure Portal.
- On the home page, click on “new cluster”.
- Choose a name for your cluster and enter it in the text box titled “cluster name”.
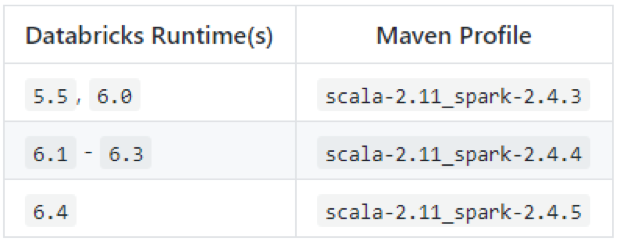
- In the “Databricks Runtime Version” dropdown, select 5.0 or later (includes Apache Spark 2.4.0, Scala 2.11).
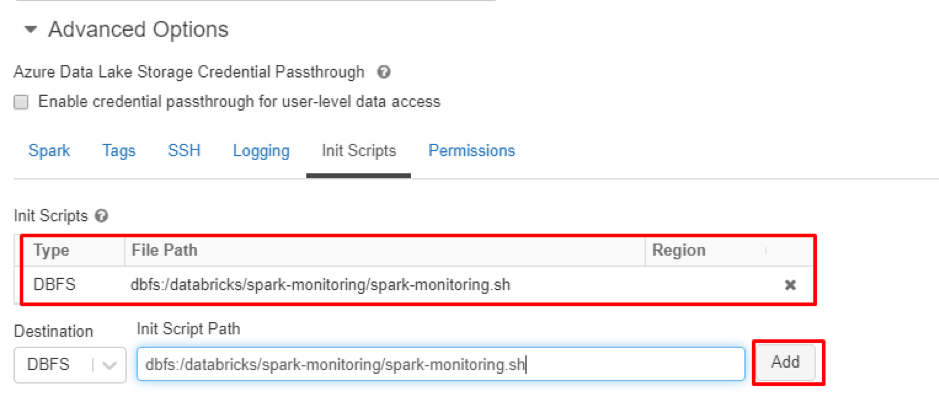
5 Under “Advanced Options”, click on the “Init Scripts” tab. Go to the last line under the
“Init Scripts section” and select “DBFS” under the “destination” dropdown. Enter
“dbfs:/databricks/spark-monitoring/spark-monitoring.sh” in the text box. Click the
“Add” button.
6 Click the “create cluster” button to create the cluster. Next, click on the “start” button to start the cluster.
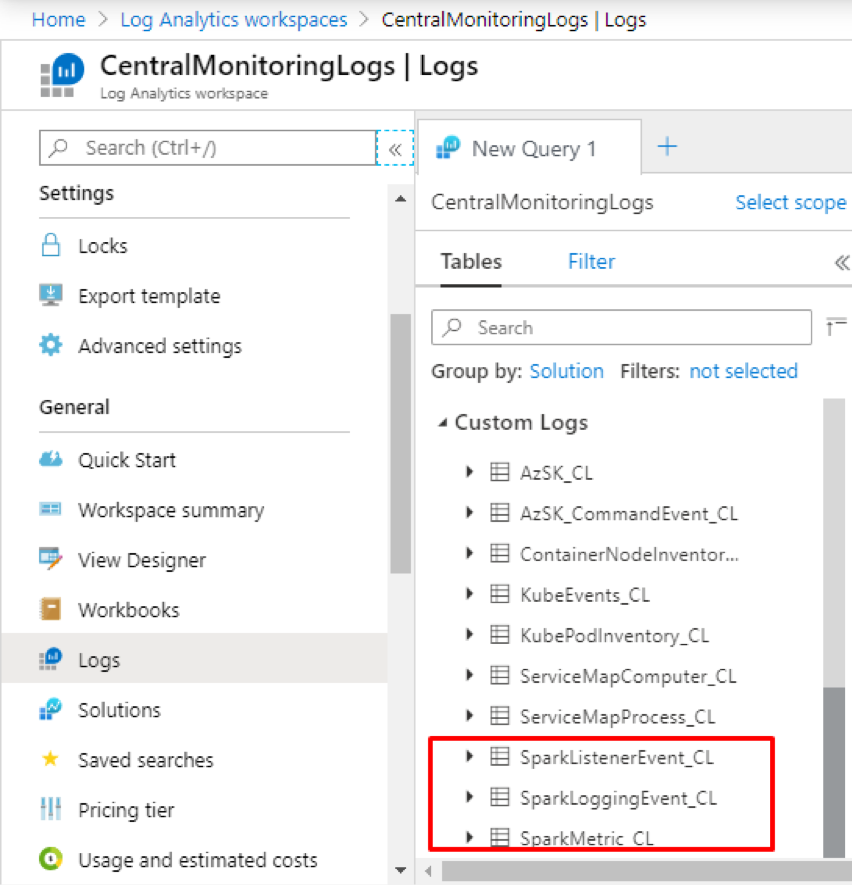
Now you can run the jobs in the cluster and can get the logs in the Log Analytics workspace
We hope this article helps you set up the right configurations to send application logs and metrics from Azure Databricks to your Log Analytics workspace.
Share this:
CloudIQ is a leading Cloud Consulting and Solutions firm that helps businesses solve today’s problems and plan the enterprise of tomorrow by integrating intelligent cloud solutions. We help you leverage the technologies that make your people more productive, your infrastructure more intelligent, and your business more profitable.
LATEST THINKING
INDIA
Chennai One IT SEZ,
Module No:5-C, Phase ll, 2nd Floor, North Block, Pallavaram-Thoraipakkam 200 ft road, Thoraipakkam, Chennai – 600097
© 2023 CloudIQ Technologies. All rights reserved.