

Cypress Automation Testing for the Modern Web
End-to-end front-end testing has always been a bit of a pain for developers. Testing is one of the critical final steps of any development project, however web testing has tested the patience of all developers at some time or another. The modern web testing ecosystem comes with its own set of challenges – from data security to additional time and expense to managing the dynamic behavior of the contemporary development frameworks. Hence, the need to bring automation to the testing process!
Benefits of Automation Testing
- Automation increases the speed of test execution
- Automation helps increase Test Coverage
- One can do automation testing at the time of regression work
- Automation testing works when GUI is the same, but you will have a lot of functional changes
When to use Automation Testing?
Here are some scenarios where Automation testing is highly recommended
- Requirements do not change frequently
- Access to the application for load and performance with many virtual users
- Steady software with respect to manual testing
- Obtainability of time
- Huge and business-critical projects
- Projects that need to test the same areas often
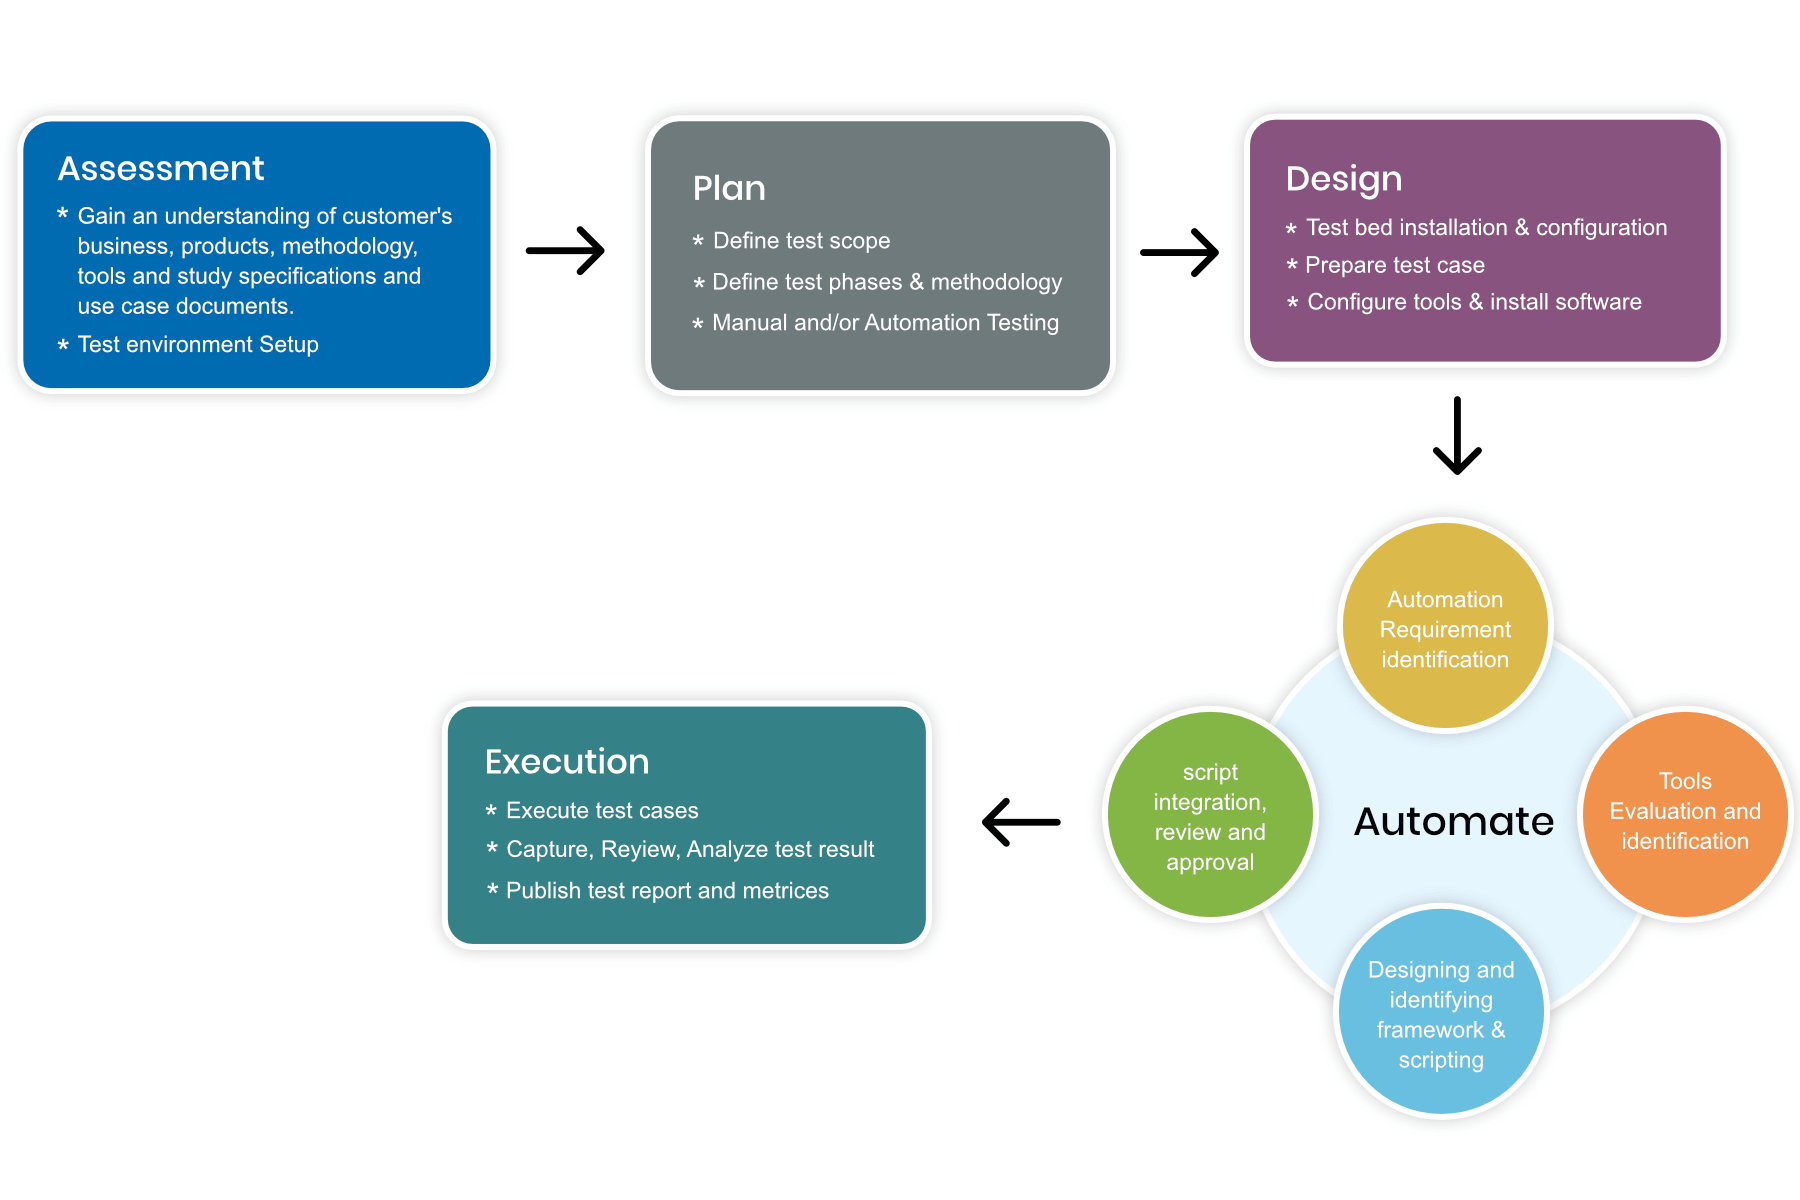
Automation testing step by step
There are lots of helpful tools to write automation scripts, however, before using those tools it’s important to identify the process for test automation.
- Identify areas within the software to automate
- Choose the appropriate tool for test automation
- Write test scripts
- Develop test suits
- Execute test scripts
- Build result reports
- Find possible bugs or performance issue
List of automation tools:
Automation of testing frameworks helps us to improve the quality, speed, and accuracy of the testing processes. Here is a list of automation tools,
- Cypress
- Selenium
- Protractor
- Appium(Mobile)
Why choose Cypress:
Cypress solves many of the main testing bottlenecks developers face regularly. It is a JavaScript-based end-to-end testing framework that doesn’t use Selenium (most widely used for testing) at all. It is built on top of Mocha and Mocha’s features is the javascript test framework running on the browser, which makes asynchronous testing simple. Cypress automatically waits for loading DOM element, elements to be visible, AJAX calls to be finished, etc. Hence, we don’t need to use implicit and explicit waits.
Another advantage Cypress offers to developers is that it runs directly in the browser with no network communication. The architecture makes testing and development happen simultaneously. It allows developers access to tools, and they can make changes and see them reflected in real-time. Naturally, this lends more precision and speed to the whole process.
Features of Cypress:
- Time travel: Cypress takes snapshots as your test runs.
- Debuggability: Cypress can guess why a test case has failed.
- Automatic waiting: There is no need to use wait or sleep because it automatically waits for your commands.
- Spies, stubs, and clocks: verify and control the behavior of functions, server response, and timer.
- Screenshot and video: Cypress testing automatically takes screenshots when your test case fails and makes a video of the complete result when it is run from the CLI.
Features of Mocha:
Mocha provides the below benefits,
- Browser support
- Async & promises support
- Test coverage reporting
Advantage of Cypress:
- Open-source
- It has Promise Support
- Java script testing framework
- Easy and reliable testing
- Fast, free and open-source
- Easy to control our response, headers, and status.
- Helps you in finding the locator
Installing Cypress:
Installing Cypress is an easy task compared to a Selenium installation. There are two commands used to install Cypress on machines. These are,
- npm init
- npm install Cypress
The first command is used to create a “package.json” file, and the second command is used to install all Cypress dependencies.
Project Folder Structure Details:
Project folder structure details as below,
*node_modules folder – It is the directory for build tools.
*package.json file – It is the file in the app root, which defines where libraries will be installed into node_modules when you run “npm install”.
*cypress folder – It contains folder like fixtures, integration, plugins, screenshot, support, and video. These folder features are below,
a. Fixture – This folder is used as external pieces of static data and can be used for your test.
b. Integration – This folder is used to write the testcase of your app.
c. Screenshot – This folder is used to store screenshots of your test.
d. Video – It is used to store videos in your test.
e. Support – This folder is used to write the common commands file.
Write your sample program in Cypress:
Step 1: Open your visual studio code in your machine
Step 2: Create a new Cypress project folder and name it as “cypresse2e”
Step 3: Open the command line and go to the above-created project path.
Step 4: Type first command under “Installing cypress” heading then wait for it to create package.json file.
Step 5: After that, type the second command
Step 6: The above task will finish within 2-3 minutes after creating the Cypress and node_modules folder inside the “cypresse2e” folder. This folder will also contain a “json” file.
Step 7: Click the Cypress folder under “cypresse2e” in vs code.
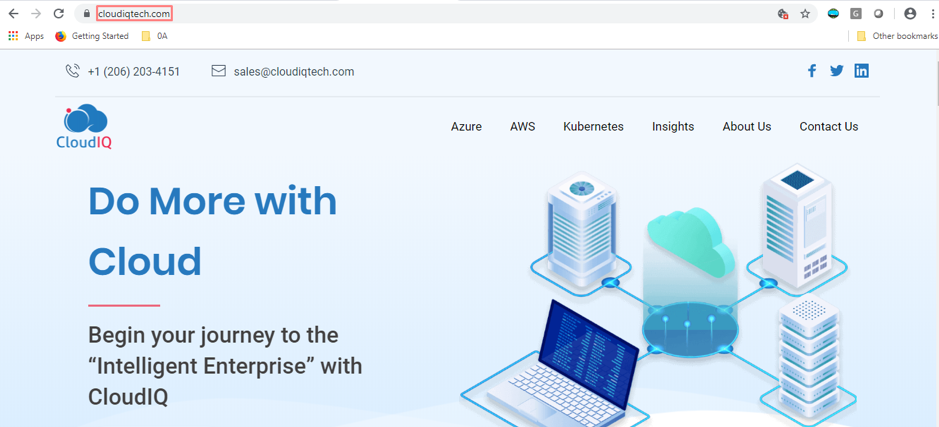
Step 8: Automation page details are as below,
We will use the CloudIQ home page link for this automation
Step 9: Create the “cypressAutomation.spec.ts” file under integration folder and write the program as seen below in the screenshot,
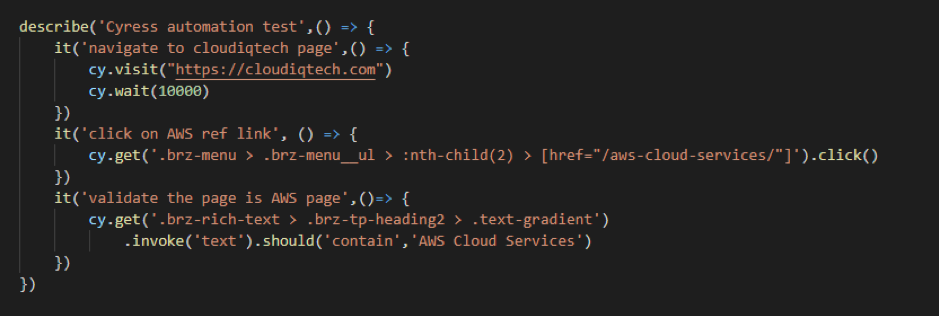
Program Explanation:
Here is what the test script given above does.
- Navigate to “cloudiqtech” site.
- Wait for 10 seconds for the page to load
- Next click on “AWS” ref link
- Then navigate to “AWS” page
- Finally, validate the current page as the AWS page.
Step 10: Open the command terminal then go to your Cypress project path then run the below-mentioned command,

Step 11: After waiting for 1-2 minutes, it will open the Cypress Terminal app, as shown below in the screenshot. It contains all the tests – like the ones you wrote in your automation test and default tests.
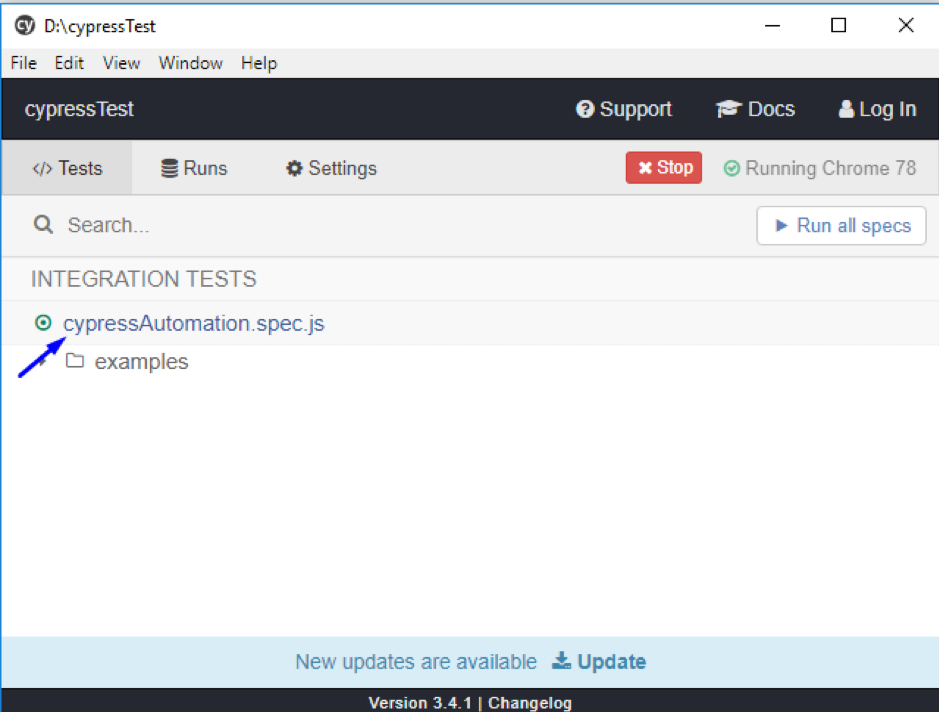
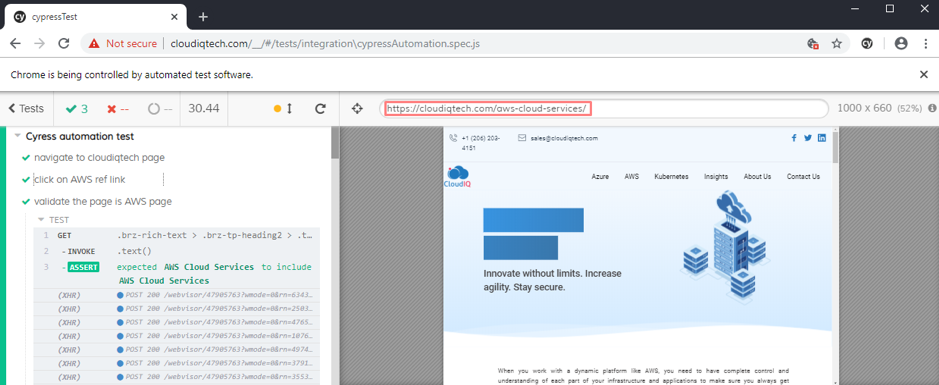
Step 12: Click your “cypressAutomation.spec.js” file, this automatically opens the default chrome browser to run your test and makes a test coverage report in your browser like below,
Test Result:
*Three tests are passed successfully.
*No tests failed here.
*In total, these three tests ran within 30.44 seconds.
*Screenshots were automatically taken during your tests. If you hover above the testcase in the test, it will display the screenshot image for every separate testcase.
Share this:

CloudIQ is a leading Cloud Consulting and Solutions firm that helps businesses solve today’s problems and plan the enterprise of tomorrow by integrating intelligent cloud solutions. We help you leverage the technologies that make your people more productive, your infrastructure more intelligent, and your business more profitable.
LATEST THINKING
INDIA
Chennai One IT SEZ,
Module No:5-C, Phase ll, 2nd Floor, North Block, Pallavaram-Thoraipakkam 200 ft road, Thoraipakkam, Chennai – 600097
© 2023 CloudIQ Technologies. All rights reserved.