CloudIQ Attains New Microsoft Solutions Partner Designations

CloudIQ is proud to announce that we have attained three Microsoft Solutions Partner designations under the new Microsoft Cloud Partner Program – Azure Infrastructure, Data & AI, and Digital & App Innovation. The new partner program replaces Microsoft Silver and Gold competencies with new Solutions Partner Designations.

Microsoft Solutions Partner Designations

For each of the six Solutions Partner Designations – Infrastructure, Data & AI, Digital & App Innovation, Modern Work, Security, and Business Applications under the new Microsoft Cloud Partner Program (MCPP) partners must meet the requirements in three different categories which are Performance, Skilling, and Customer Success.

And we are happy to share that we have attained three of the six solution partner designations.

Microsoft Specializations

On top of the Solution Partner Designations, Microsoft also has advanced specialization programs that help demonstrate advanced technical expertise.

CloudIQ has earned advanced specialization in the Modernization of Web Applications to Azure and Kubernetes on Microsoft Azure.

Attaining the Microsoft Solution Partner Designations and Microsoft Advanced Specializations goes to show CloudIQ’s expertise and commitment to delivering best-in-class solutions for customers in any scenario and every industry.

We leverage our deep industry expertise to help businesses envision new products, create innovative business models, and deliver the next level of customer experiences by leveraging the cloud. From standalone cloud projects to enterprise-wide cloud architecture design you can rely on our cloud engineering expertise.

Get in touch with us to learn more.

When systems evolve the need to migrate database does arise based on the data we are dealing with. In one of our projects, we had a scenario where non-transactional data had to be accessed frequently with low latency across regions. Azure Cosmos DB is Microsoft’s fast NoSQL database and the first globally distributed database service in the market today to offer comprehensive service level agreements encompassing throughput, latency, availability, and consistency.

So, the choice was clear for us to move the data from PostgreSQL to CosmosDB. In PostgreSQL the data format is flat (i.e., in the form of tables and columns), while CosmosDB supports flexible schemas and hierarchical data, and thus it is well suited for storing catalog data. Provides. JSON format supported by Cosmos DB is an effective format that is very lightweight.

For the data migration from PostgreSQL to CosmosDB we chose Azure Data Factory. Azure Data Factory helps you integrate, perform transformations, and visualize all your data with ease. Azure Data Factory is easy to use, cost-effective, a fully serverless cloud service that accelerates data transformation with code-free data flows.

Data Transformation using Azure Data Factory

Azure Data Factory is an orchestration tool that is used to transform the data from one source to another. It can process and transform the raw data into predictions and insights. It allows you to perform data transformation activities via pipelines. Data flows are created in debug mode to validate the logic of the transformation. The data flow activity is added to the pipeline to execute and test the data flow. And “trigger now” is employed to test the data flow that is in the pipeline.

Several options are available for converting JSON data to flat data, however when it comes to converting flat data into JSON, it is still a challenge. With JSON, inserting null value within the data flow is quite tedious and a unique pipeline must be created to handle null values.

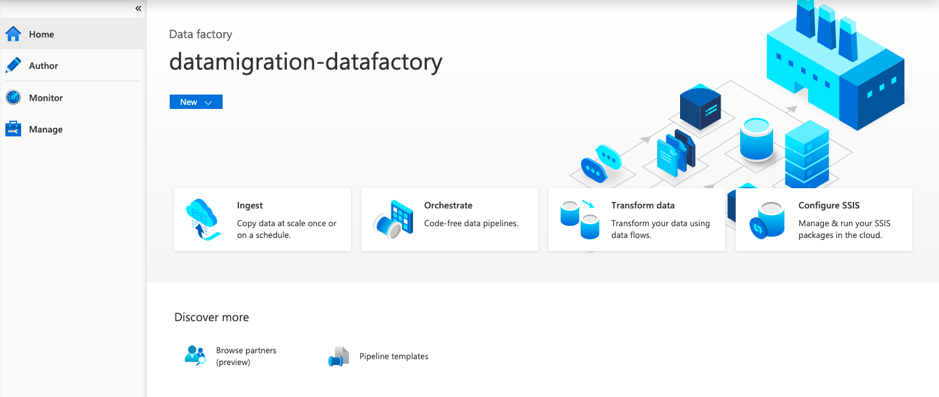
The Azure Data factory has three main options:

  • Author
  • Monitor
  • Manage

The Author option provides the main environment for development. Using this option, we can design and manage Azure Data Factory resources such as the pipelines and dataflows.

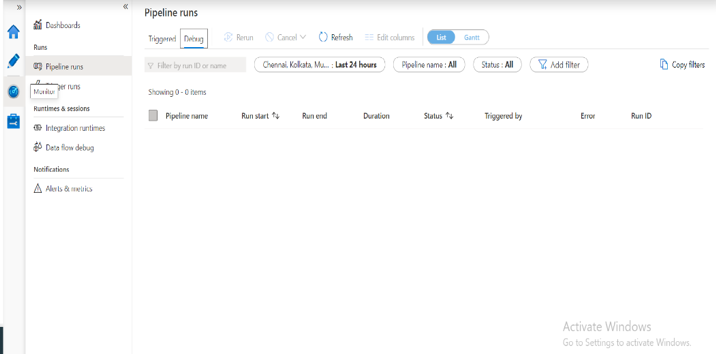
The Monitor option allows you to monitor the pipelines; trigger runs; sessions; the time taken for execution and running the pipelines; check if the execution of the pipeline was a success or failure and set up alerts.

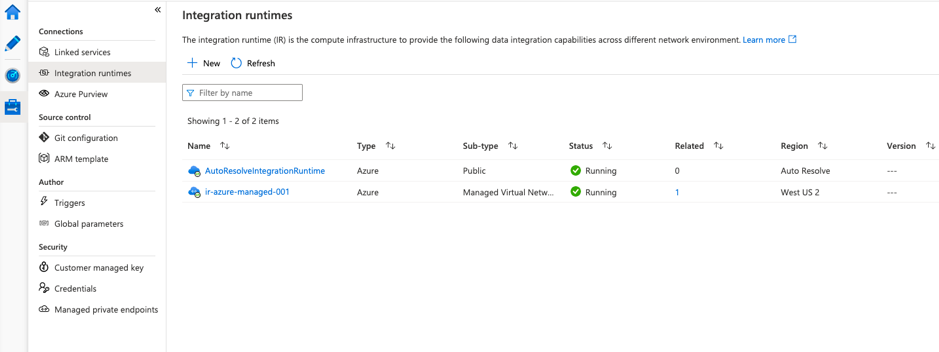
The Manage option allows you to manage the connections, link service, source control, triggers, parameters, and security.

Now let’s look at how to migrate from PostgreSQL to CosmosDB and transform the data.

Pipeline and activities creation

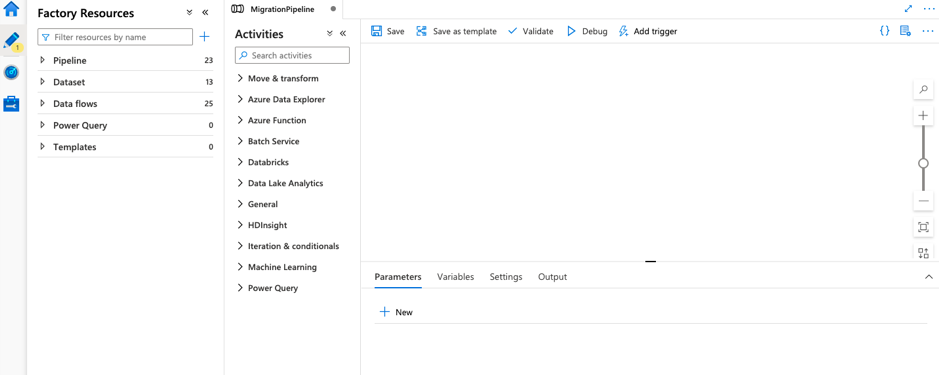
The Author option provides the environment for the development of pipelines and data flows. So, the first step is to create a pipeline that contains the data flow activity. The pipeline is a logical grouping of activities that perform a task. By clicking on orchestrate on the home page, we create and name the pipelines.

The activities pane allows you to perform various activities such as move, transform, add data flow (we can use existing data flows or even create new data flows), Azure data explorer, Azure function, Batch Service, Databricks, Data Lake Analytics, etc. Once the data flow is created, we can provide the transformation logic in the data flow canvas. The dataflows distribute the processing of data over different nodes in a Spark cluster to perform the operations parallelly. We need to create a mapping data flow to perform the transformation as well.

We can choose the format of the data as per the requirement. We can also select the dataset, which is simply the view of data or the references of the data that you want to employ in your activity.

In our data migration scenario, say for an activity to copy data from the source (PostgreSQL data directory), the data is taken from the source and put in the blob storage. The basic details are stored in the first copy activity, the patient color details are stored in the second, microchip details are stored in the third, breed details in the fourth and existing patient details are stored in the fifth copy activity respectively. The data flow performs transformations to the data such as join, conditional join, aggregate, pivot, flatten, union, split, etc. And finally, triggers are scheduled for doing transformation in the pipelines.

Linked Service and Integration Runtime

When creating a dataset, first we must create a linked service to link the data store to Data Factory via the management hub. Linked services are much like connection strings and defines the connection to the data source.

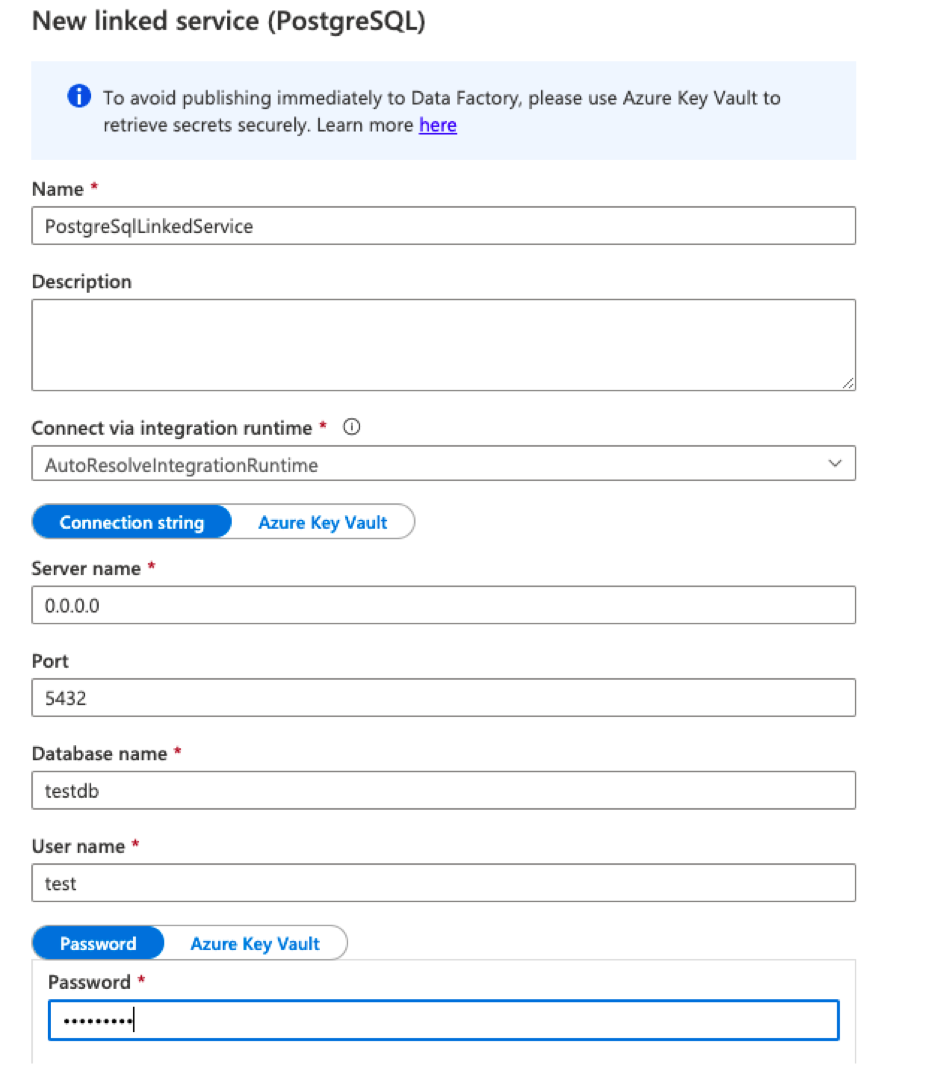
In our data migration scenario, we have created the following linked services for Azure Managed Instance, Azure Blob storage, CosmosDB (one for dev and one for UI), and PostgreSQL. To create the linked service, we must provide the server’s name, port, database name, username, password, etc. These are the input for dataflow to connect to the specific database. In this migration, the PostgreSQL data is migrated from a different VM environment into the Azure environment.

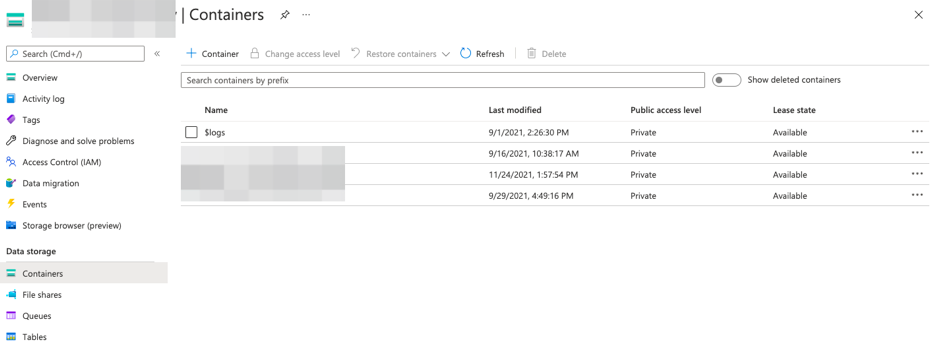
Here, the base directory is called containers, inside the containers we have several directories which further contain storage files.

The integration runtime via the management hub is the compute infrastructure for providing data integration capabilities such as data flow, data movement, activity dispatch, and SSIS package execution across different network environments. It provides the linkage between the activity and linked services. The default option is public for the Auto-resolve integration runtime. We can also create private customized ones based on the requirement for dataflow execution.

We hope this walkthrough of migrating data from PostgreSQL to Azure CosmosDB using Azure Data Factory was helpful. If you have queries or want us to help you with your data migration projects, feel free to reach out to us.

Azure App Service is a Platform as a Service (PaaS) that is used to build, deploy, and scale enterprise-grade applications such as web apps, mobile apps, logic apps, API apps, and function apps. It supports multiple programming languages and frameworks such as NET, .NET Core, Java, Ruby, Node.js, PHP, Python.

From a developers perspective Azure App Service provides a great platform to develop, deploy and scale applications.  However, when it comes to production environments Infrastructure as code (IaC) comes in handy. Terraform is an open-source IaC tool with a consistent CLI that lets you write infrastructure as code using declarative configuration files and also, manage, plan and apply changes to infrastructure versions to reach the required configuration state.

Terraform is a good choice as it reduces manual human error by codifying the application infrastructure. Terraform manages infrastructure across more than 300 public clouds and it provides a reusable, cost-effective, and consistent environment that solves dependencies and version controls. In this article, we will take you through the process of deploying a web app in Azure App Service using Terraform.

To deploy the web app in Azure App Service using Terraform, here are the steps we need to follow:

  • Create the Resource Group
  • Create App Service plan and deploy web app

Create the Resource Group:

The first step is to create a resource group using the following terraform code. Any resource that is created must be created within the resource group

terraform {    
  required_providers {    
    azurerm = {    
      source = "hashicorp/azurerm"    
    }    
  }    
} 
   
provider "azurerm" {    
  features {}    
}

resource "azurerm_resource_group" "resource_group" {
  name     = "app-service-rg"
  location = "East US"
}

Create App Service plan and deploy web app

The App Service plan defines the capacity and resources to be shared among one or more app services that are assigned to that plan. Azure WebApp must be associated with an App Service Plan as it specifies the computing resources that are required for the web app to function. The following code creates an app service plan.

resource "azurerm_app_service_plan" "app_service_plan" {
  name                = "example-appserviceplan"
  location            = azurerm_resource_group.resource_group.location
  resource_group_name = azurerm_resource_group.resource_group.name

  sku {
    tier = "Standard"
    size = "S1"
  }
}

And add code for creating app service. Finally, the terraform file looks like the below

terraform {    
  required_providers {    
    azurerm = {    
      source = "hashicorp/azurerm"    
    }    
  }    
} 
   
provider "azurerm" {    
  features {}    
}

resource "azurerm_resource_group" "resource_group" {
  name     = "app-service-rg"
  location = "East US"
}

resource "azurerm_app_service_plan" "app_service_plan" {
  name                = "myappservice-plan"
  location            = azurerm_resource_group.resource_group.location
  resource_group_name = azurerm_resource_group.resource_group.name

  sku {
    tier = "Standard"
    size = "S1"
  }
}

resource "azurerm_app_service" "app_service" {
  name                = "mywebapp-453627 "
  location            = azurerm_resource_group.resource_group.location
  resource_group_name = azurerm_resource_group.resource_group.name
  app_service_plan_id = azurerm_app_service_plan.app_service_plan.id

  #(Optional)
  site_config {
dotnet_framework_version = "v4.0"
    scm_type                 = "LocalGit"
  }
  
  #(Optional)
  app_settings = {
    "SOME_KEY" = "some-value"
  }

}

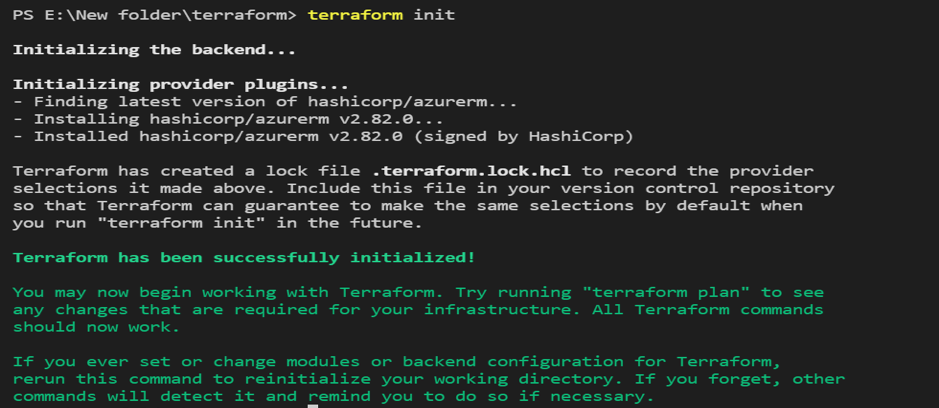
Now, we should run the following command to initiate terraform.

Command: terraform init

To create an execution plan, we should run the terraform plan command

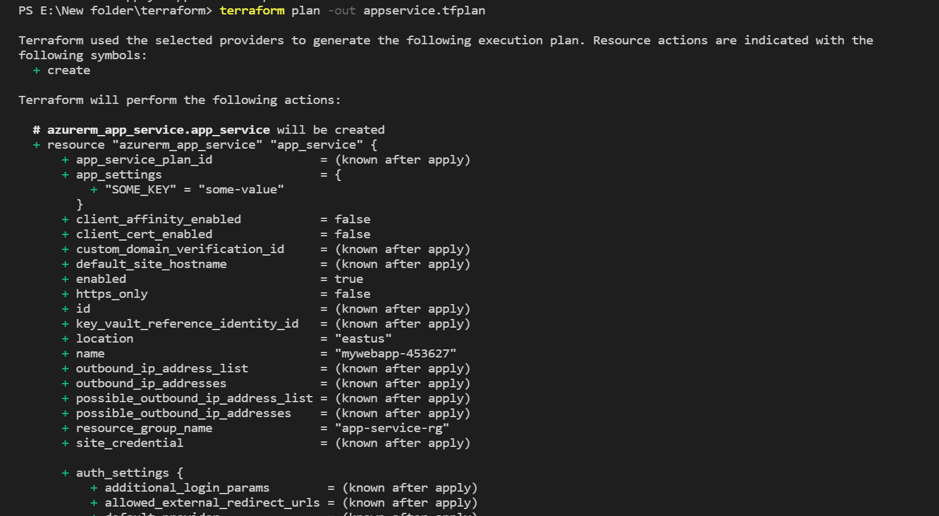
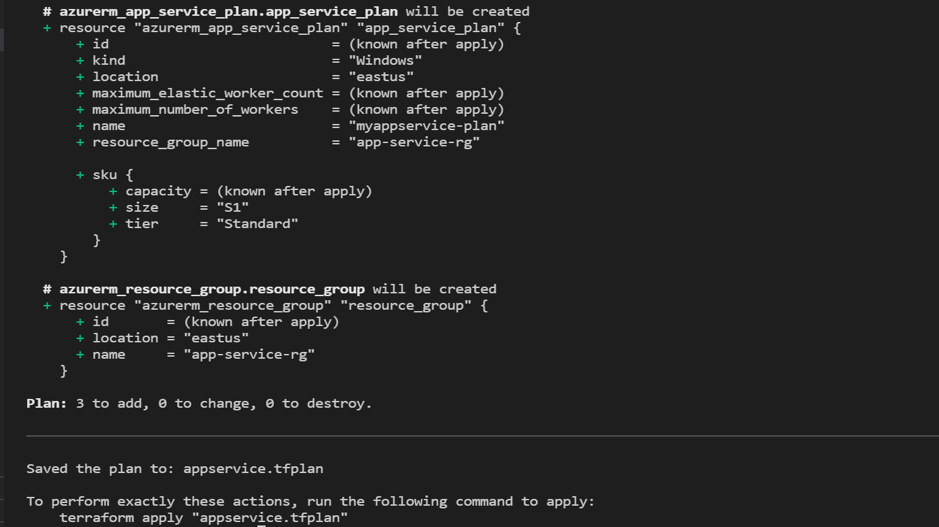
Command: terraform plan -out appservice.tfplan

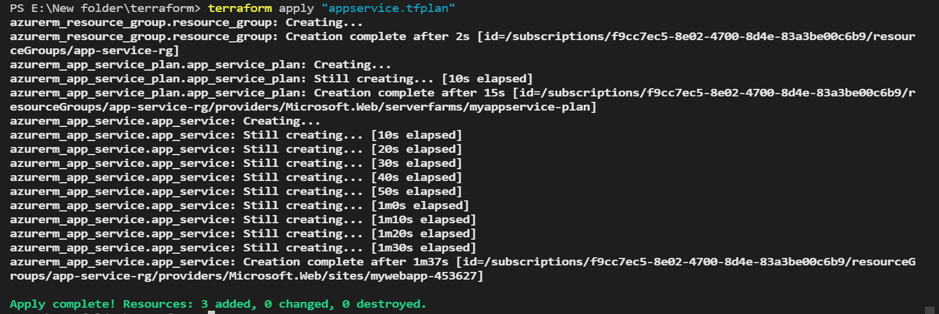
To apply the plan, run the following command

Command: terraform apply ” appservice.tfplan “

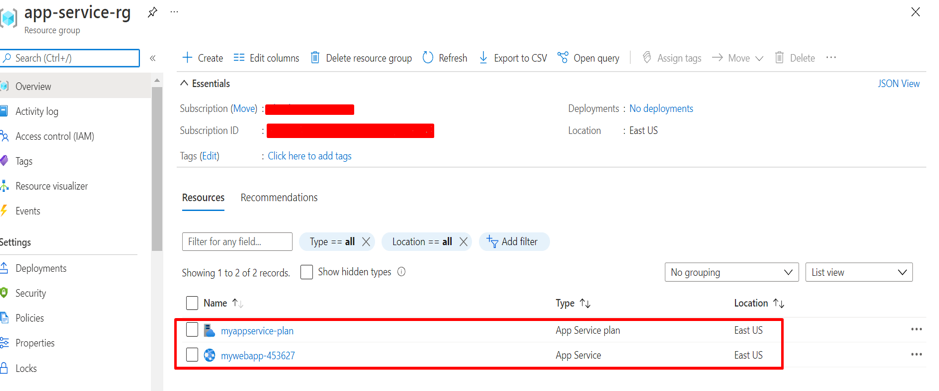
We can verify the app service created in the specified app service plan and resource group by checking in the Azure portal

Hope you found this article useful. Stay tuned for more articles coming up on Azure App Service and Terraform.

With an average cost of a data breach at $3.86 million last year, it’s wise to employ a good backup system. More than 80% of the fortune 500 companies use Microsoft Azure for running their businesses effortlessly as they are simple, ever-evolving, secure and cost effective. So, in this article let’s explore how to backup and restore Azure Managed Disks using Azure Backup Vault.

Azure Backup services allow you to back up your data and recover it from the Microsoft Azure cloud. They backup and store the data in the backup vaults. These backup vaults make certain that the backups are successful by monitoring and tracking the storage containers, they optimize the resources by automating maintenance tasks and they also provide better security and access control to store and recover data.

Data sources that are supported by Azure Backup include

  • Azure Database for PostgreSQL servers,
  • Azure Blobs, and
  • Azure Disks.

Prerequisites for performing disk backup and restore operations

Backup Vault’s managed identity needs the below roles to be assigned to it for performing disk backup and restore operations:

  • Disk Backup Reader role on the Source disk that needs to be backed up.
  • Disk Snapshot Contributor role on the Resource group where backups are created and managed by Azure Backup.
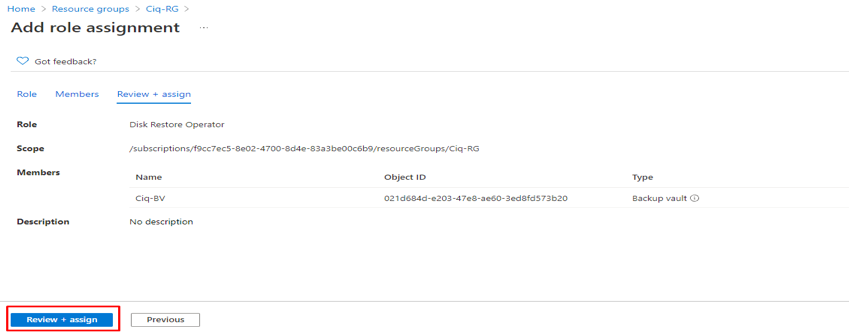
  • Disk Restore Operator role on the Resource group where the disk will be restored by the Azure Backup.

To assign Azure roles, the user must have Microsoft.Authorization/roleAssignments/write permissions, such as User Access Administrator or Owner.

Steps to backup managed disks:

Create a Backup vault

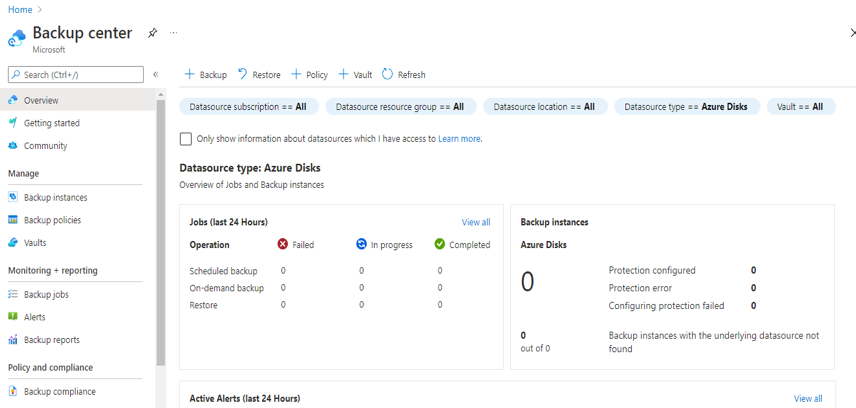
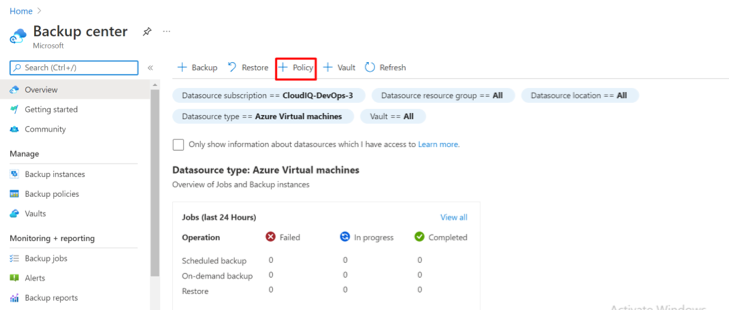
  1. Go to Backup center service in Azure portal. Backup center enables enterprises to govern, monitor, operate, and analyze backups at scale. Jobs performed in last 24 hours are displayed in the Overview tab. Operations such as Scheduled backup, On-demand backup and Restore are listed along with the status of each operation (Failed, In progress or Completed)

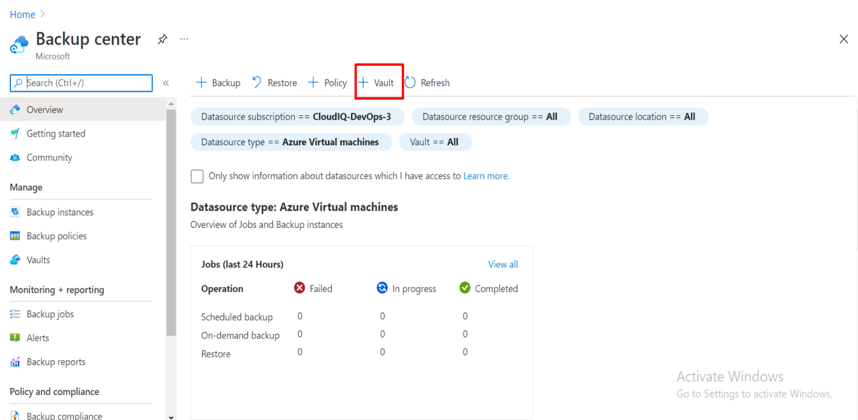
2. Select Vault from the Overview tab

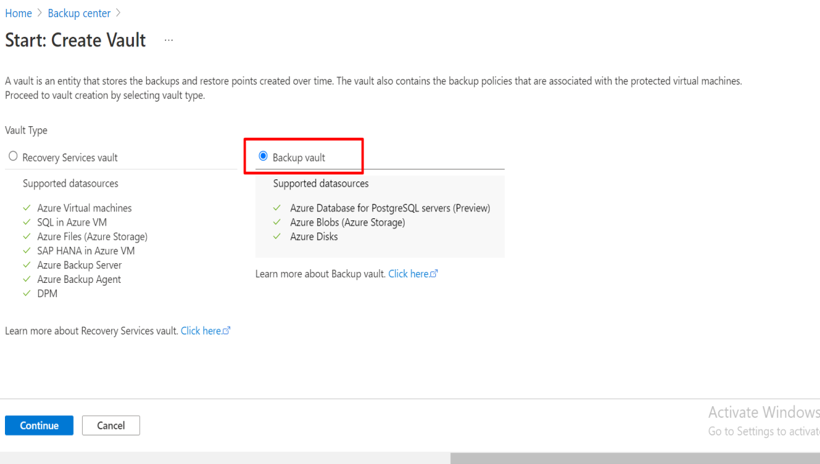
3. In Start: Create Vault page, select Backup vault and then Continue

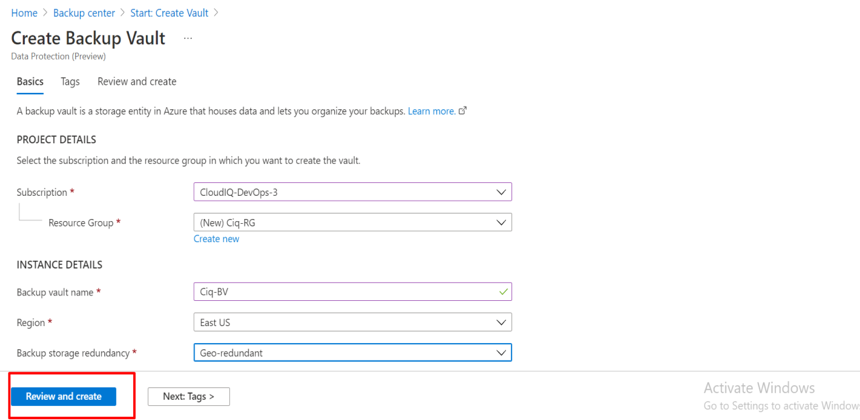
4. In Basics tab,

  • Under PROJECT DETAILS, select the Subscription and Resource group of the vault to be created.
  • Under INSTANCE DETAILS, type in the Backup vault name.
  • Select the region of the backup vault and backup storage redundancy
  • Select Review and create

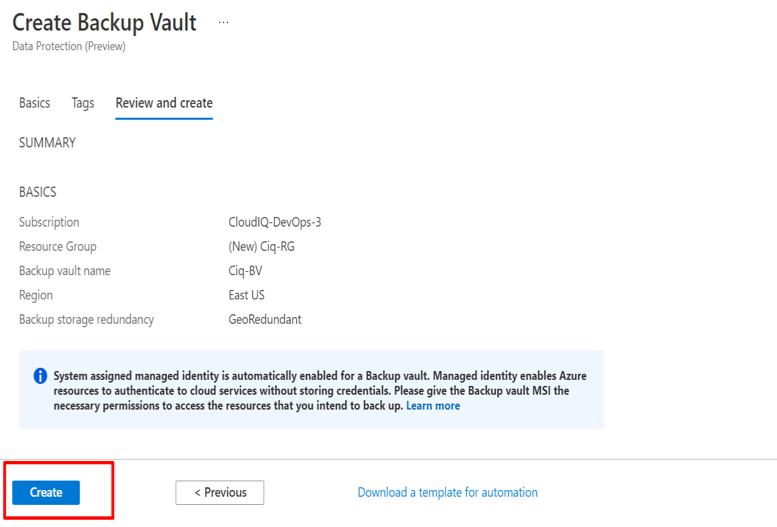
5. Select Create. The Backup vault will be created.

Create a backup policy

  1. Select Policy from Backup center’s Overview tab

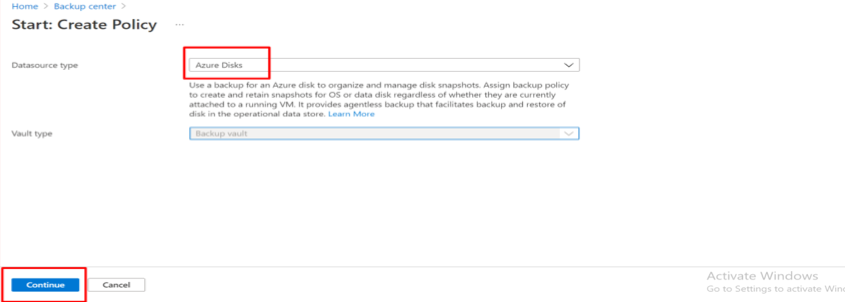
2. In Start: Create Policy page, select Datasource type as Azure Disks and Vault type is prepopulated as Backup vault. Then, select Continue.

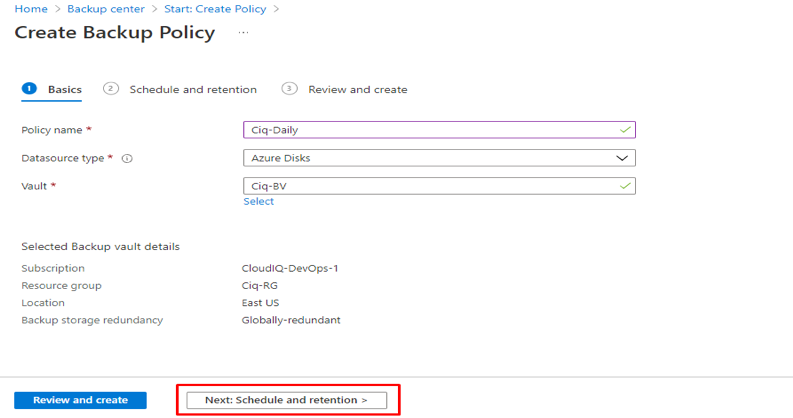
3. In the Basics tab, type in the policy name to be created. Select Datasource type as Azure Disk and select Vault as the Backup vault that was just created. Click on Next: Schedule and Retention to go to next tab.

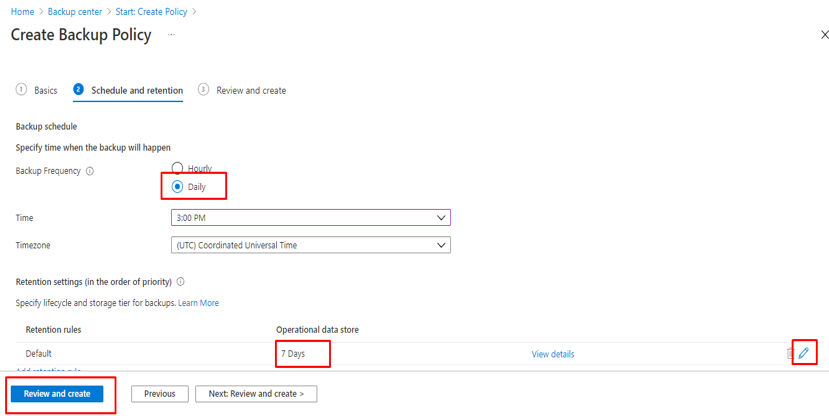
4. In the Schedule and retention tab,

  • Under Backup schedule, select the backup schedule frequency and specify the time when backup must happen.
  • Specify the number of days backup should be retained under Retention settings.

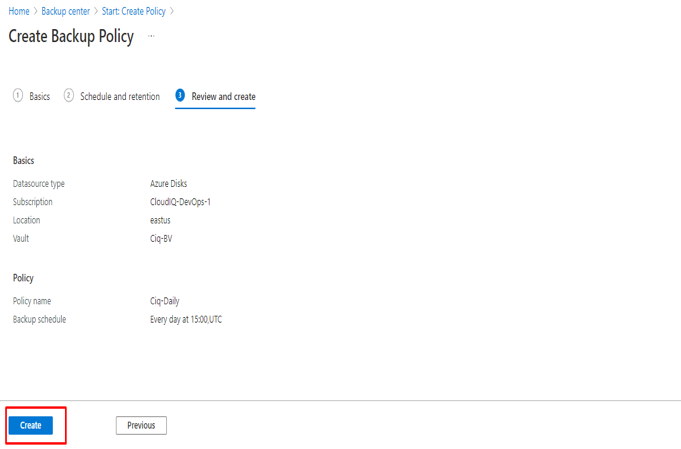
5. After validation, in Review and Create tab, select Create. The Backup policy is created.

Configure backup of an Azure Disk

To backup an azure disk,

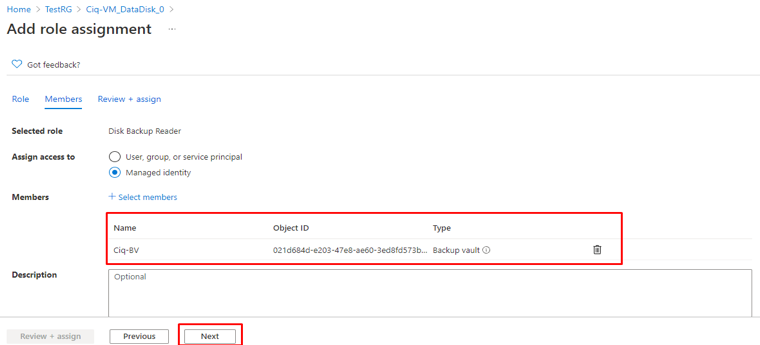
  1. Assign Disk Backup Reader role on the Source disk that needs to be backed up to the Backup vault’s managed identity.
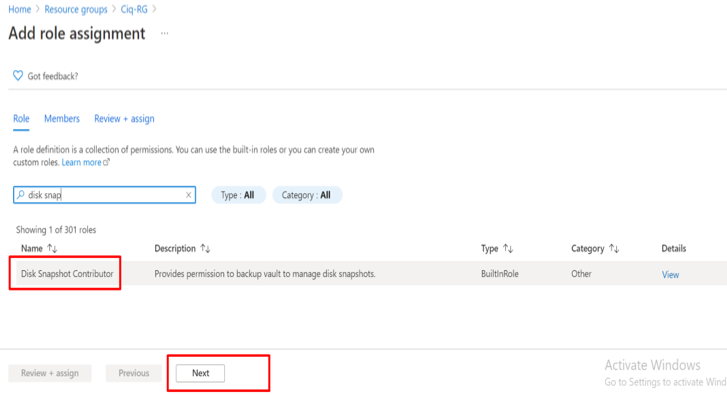
  2. Assign Disk Snapshot Contributor role on the Snapshot Resource group to the Backup vault’s managed identity.

a)     Steps to Assign Disk Backup Reader role on the Source Disk

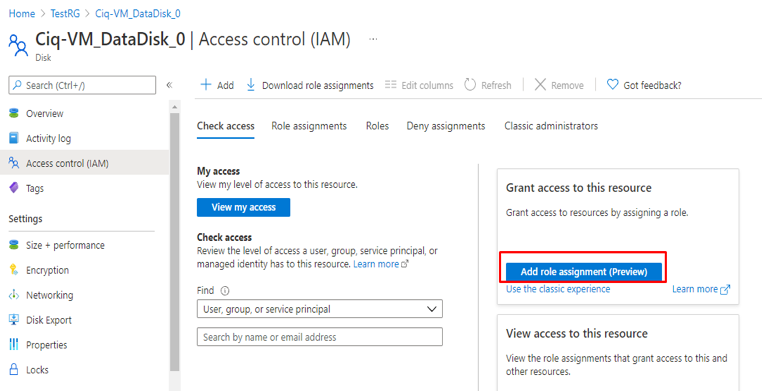
  1. Go to the source disk that we need to configure backup for.
  2. Select access control (IAM) and Add role assignment

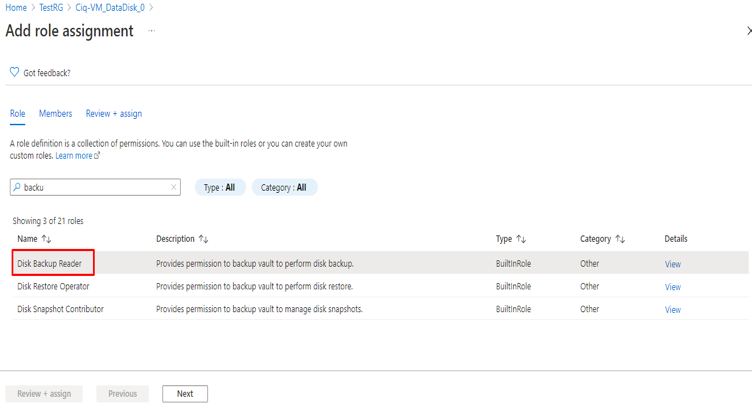
3. In Role tab, search for the role Disk Backup Reader and select it

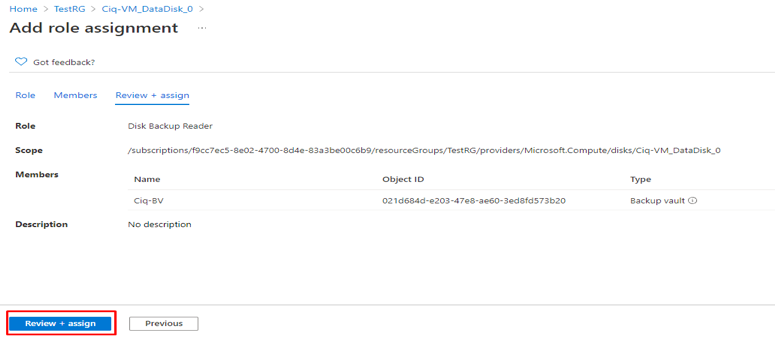
4. In Members tab, select assign access to Managed identity and select members as the Backup vault.

5. Select Review+ assign. Assignment of Disk Backup Reader role to the Backup vault is done.

b)     Steps to Assign Disk Snapshot Contributor role on the Snapshot Resource group

  1. Go to the target Snapshot resource group.
  2. Select access control (IAM) and Add role assignment

3. In Role tab, search for the role Disk Snapshot Contributor and select it

4. In Members tab, select assign access to Managed identity and select members as the Backup vault.

5. Select Review+ assign. Assignment of Disk Snapshot Contributor role to the Backup vault is done.

Steps to Backup an Azure Disk

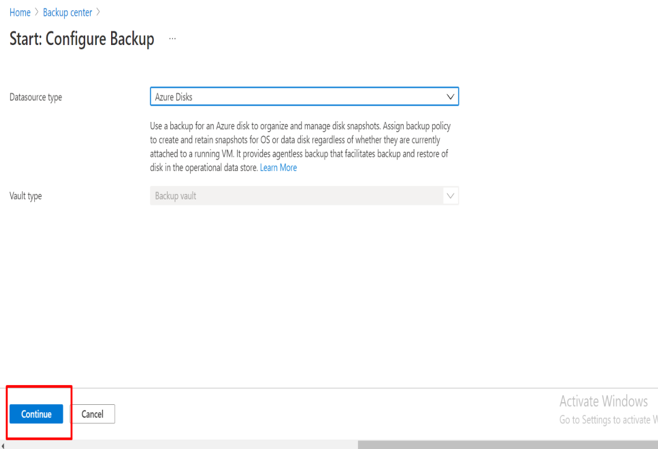
  1. In Backup center, Select Backup from the Overview tab

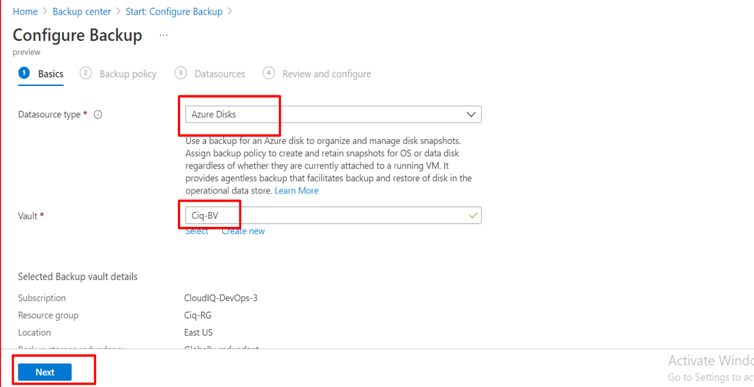
2. In Start: Configure Backup, select Datasource type as Azure Disks and Vault type is prepopulated as Backup vault.

3. In Basics tab, select Datasource type as Azure Disks,select the Vault created and then Next.

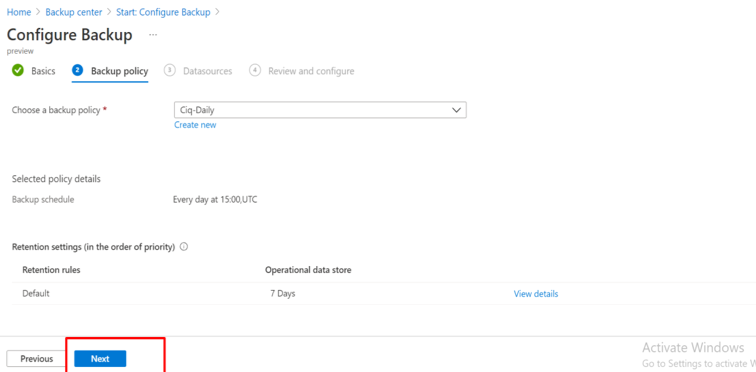
4. In Backup policy tab, Select the backup policy.

5. In Datasources tab:

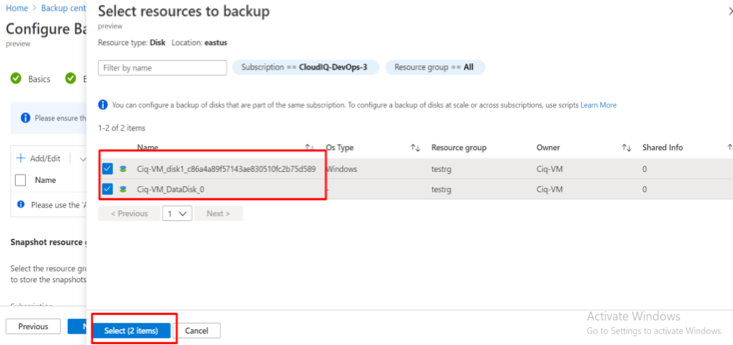
a) Click on Add/Edit and select the disks to backup.

b) Click Select after selection of disks.

c) Select Snapshot Resource Group, the resource groupwhere snapshots of disks are stored. Once the disk backup is configured, the Snapshot Resource Group that’s assigned to a backup instance cannot be changed.

d) Select Validate. Click Next.

6. In Review and Configure tab, Select Configure Backup. The configuration of backup for the disk is done.

For the validation to be successful, We must assign Disk Backup Reader role on the Source disk that needs to be backed up to the Backup vault’s managed identity and Disk Snapshot Contributor role on the Snapshot Resource group to the Backup vault’s managed identity.

On demand backup of an Azure Disk

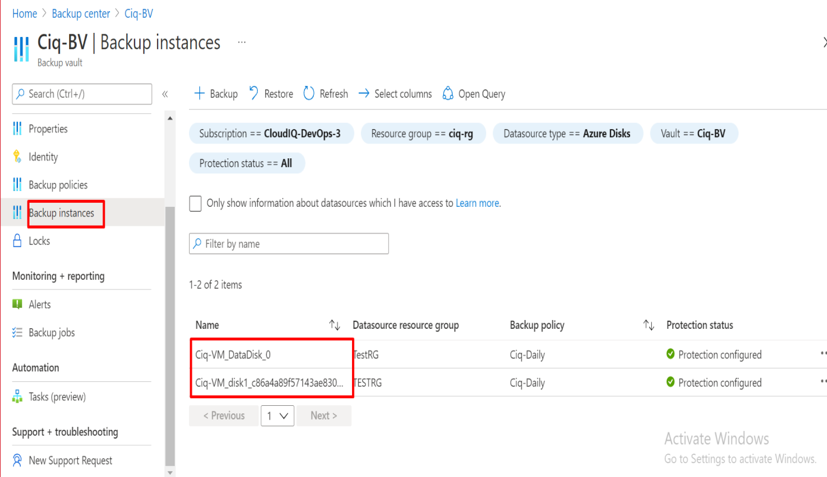
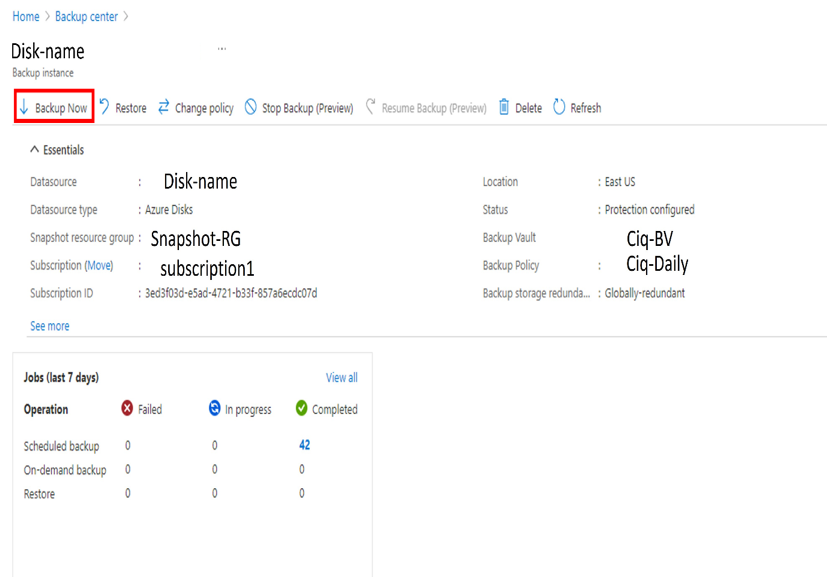
  1. In the Backup Vault, go to Backup Instances and select the disk to perform on demand backup

2. Select Backup Now.

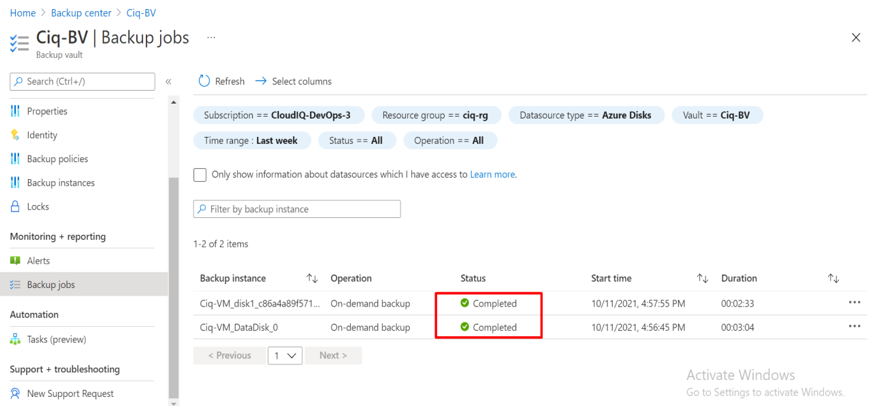
3. In Backup vault, go to Backup jobs to view the status of the backup.

Restore an Azure Disk from backup

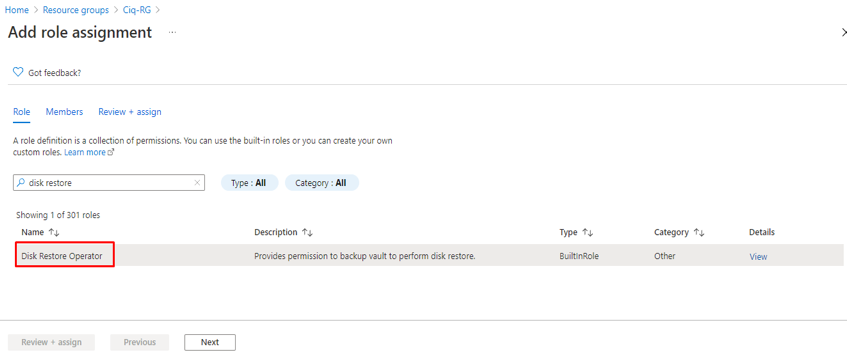
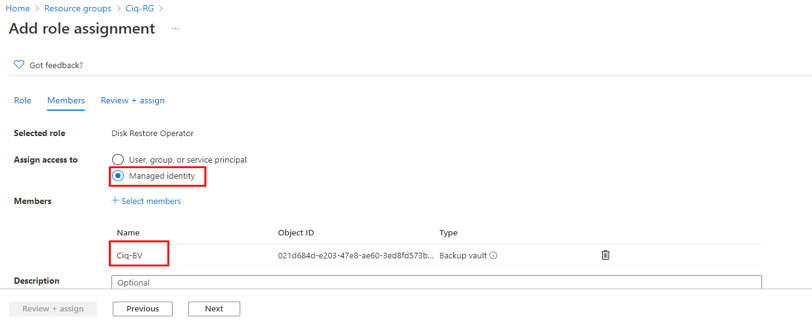
To restore an azure disk, we need to assign Disk Restore Operator role to Backup vaults managed identity on the Resource group where the disk will be restored by the Azure Backup.

Steps to Assign Disk Restore Operator role on the Target Resource group

  1. Go to the target resource group.
  2. Select access control (IAM) and Add role assignment

3. In Role tab, search for the role Disk Restore Operatorand select it

4. In Members tab, select assign access to Managed identity and select members as the Backup vault.

5. Select Review+ assign. Assignment of Disk Restore Operatorrole to the Backup vault is done.

Steps to Restore an Azure Disk

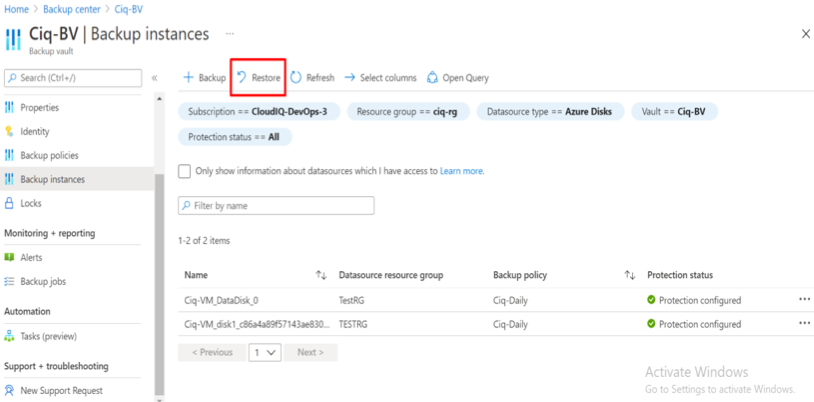
  1. Go to Backup center -> select Backup vault -> select Restore

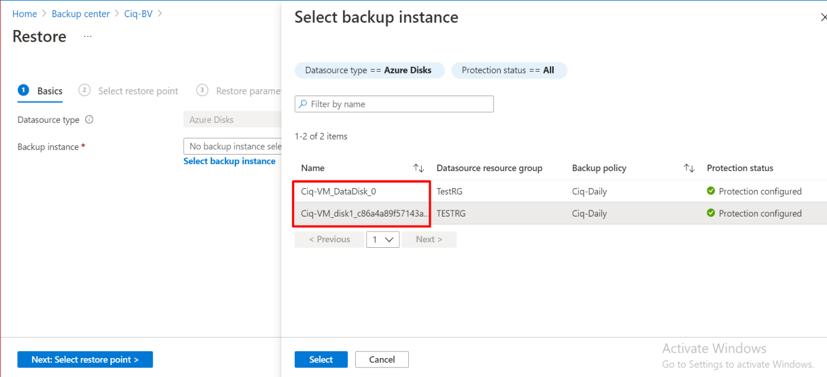
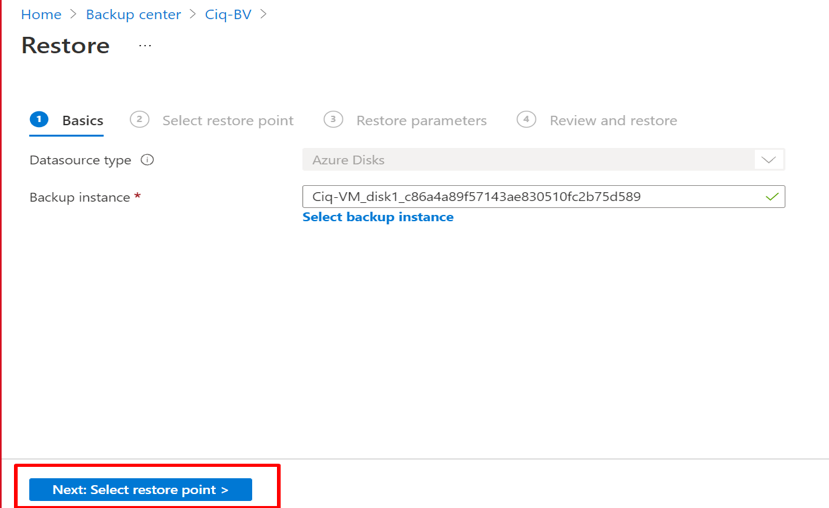
2. In Basics tab, Select the Backup instance as the disk that needs to be restored and then Next.

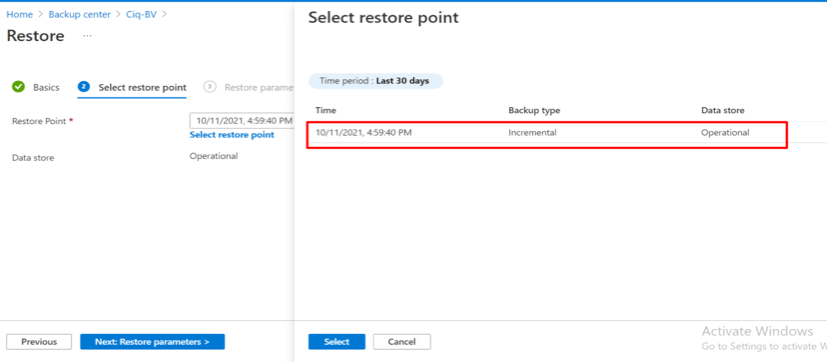
3. In Select Restore Point tab, select the required or latest restore point.

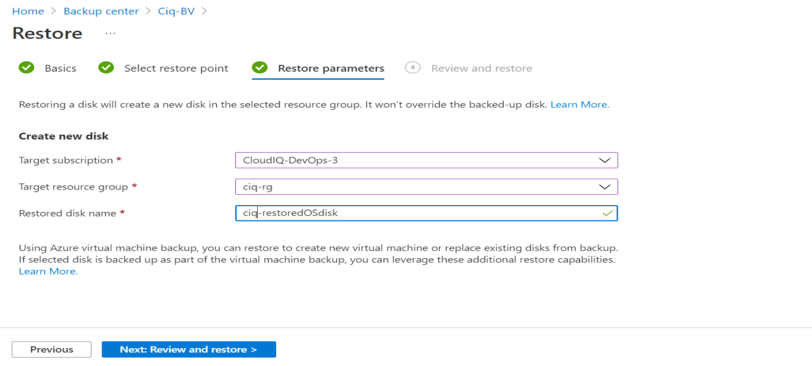
4. In Restore parameters, select Target subscription, and Target resource group. Type in the Restored disk name and select Next:Review and restore.

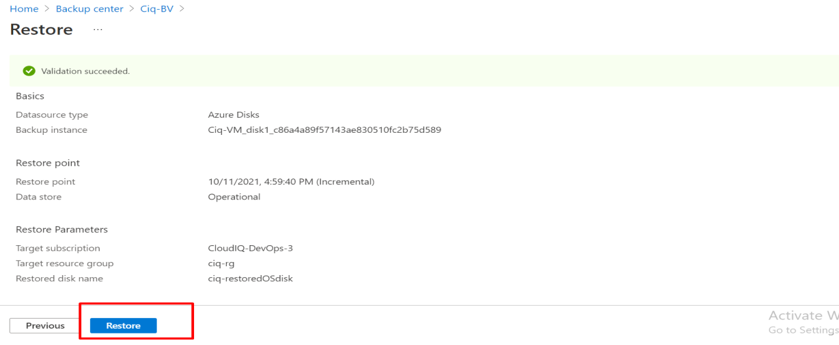
5. After validation, click on Restore. The restore operation is started.

Note: If validation is unsuccessful, follow the steps to Assign Disk Restore Operator role on the Target Resource group.

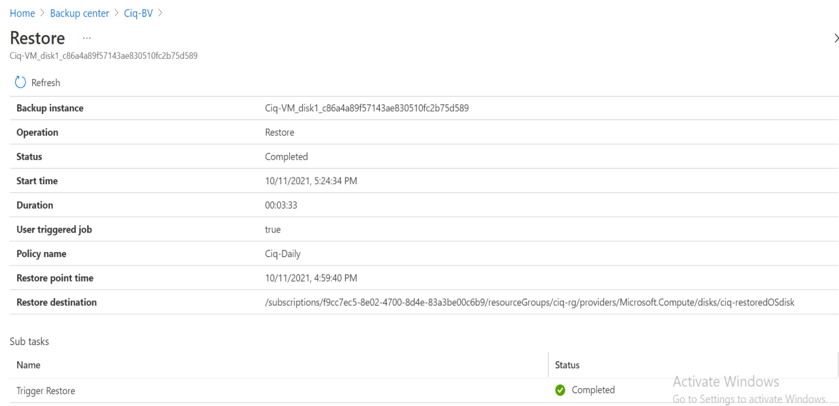
6. Restore operation is now completed.

Seattle [23 Jun 2021] – CloudIQ Technologies Inc today announced it has earned the Kubernetes on Microsoft Azure advanced specialization, a validation of a solution partner’s deep knowledge, extensive experience and proven expertise in deploying and managing production workloads in the cloud using containers and managing hosted Kubernetes environments in Microsoft Azure.

Only partners that meet stringent criteria around customer success and staff skilling, as well as pass a third-party audit of their container-based workload deployment and management practices, are able to earn the Kubernetes on Azure advanced specialization.

With over 75% of global organizations expected to run containerized applications in production by 2022, many are looking for a partner with advanced skills to migrate their existing containerized workloads to the cloud, or assist them in developing cloud-native applications using container technologies, DevOps patterns, and a microservices approach.

“With our deep expertise in cloud-native architecture design, we help clients build and run scalable applications with improved security, faster release cycles, easier management, and lower costs”, said Mr. Prem Kandalu, CEO. “As a partner who has earned the Kubernetes on Microsoft Azure advanced specialization, CloudIQ will pass on the benefits of our continued collaboration with Microsoft to our clients.”

Rodney Clark, Corporate Vice President, Global Partner Solutions, Channel Sales and Channel Chief at Microsoft added, “The Kubernetes on Microsoft Azure advanced specialization highlights the partners who can be viewed as most capable when it comes to deploying and managing containerized applications in Azure. CloudIQ Technologies clearly demonstrated that they have both the skills and the experience to deliver best-in-class cloud-native capabilities to customers with Azure.

About CloudIQ Technologies

CloudIQ is a leading cloud consulting and solutions firm that helps businesses envision new products, create innovative business models, and deliver the next level of customer experiences by leveraging the cloud. From standalone cloud projects to enterprise-wide cloud architecture design you can rely on our cloud engineering expertise.

As a Microsoft Gold Partner (Cloud Platform), earner of the Modernization of Web Applications on Microsoft Azure and Kubernetes on Microsoft Azure advanced specializations, Kubernetes Certified Service Provider (KCSP) and Kubernetes Training Partner (KTP), we serve as trusted advisors to Fortune 500 organizations and leverage our deep industry expertise in building cloud-native solutions to help our clients realize the cost, scale and security benefits of the cloud.

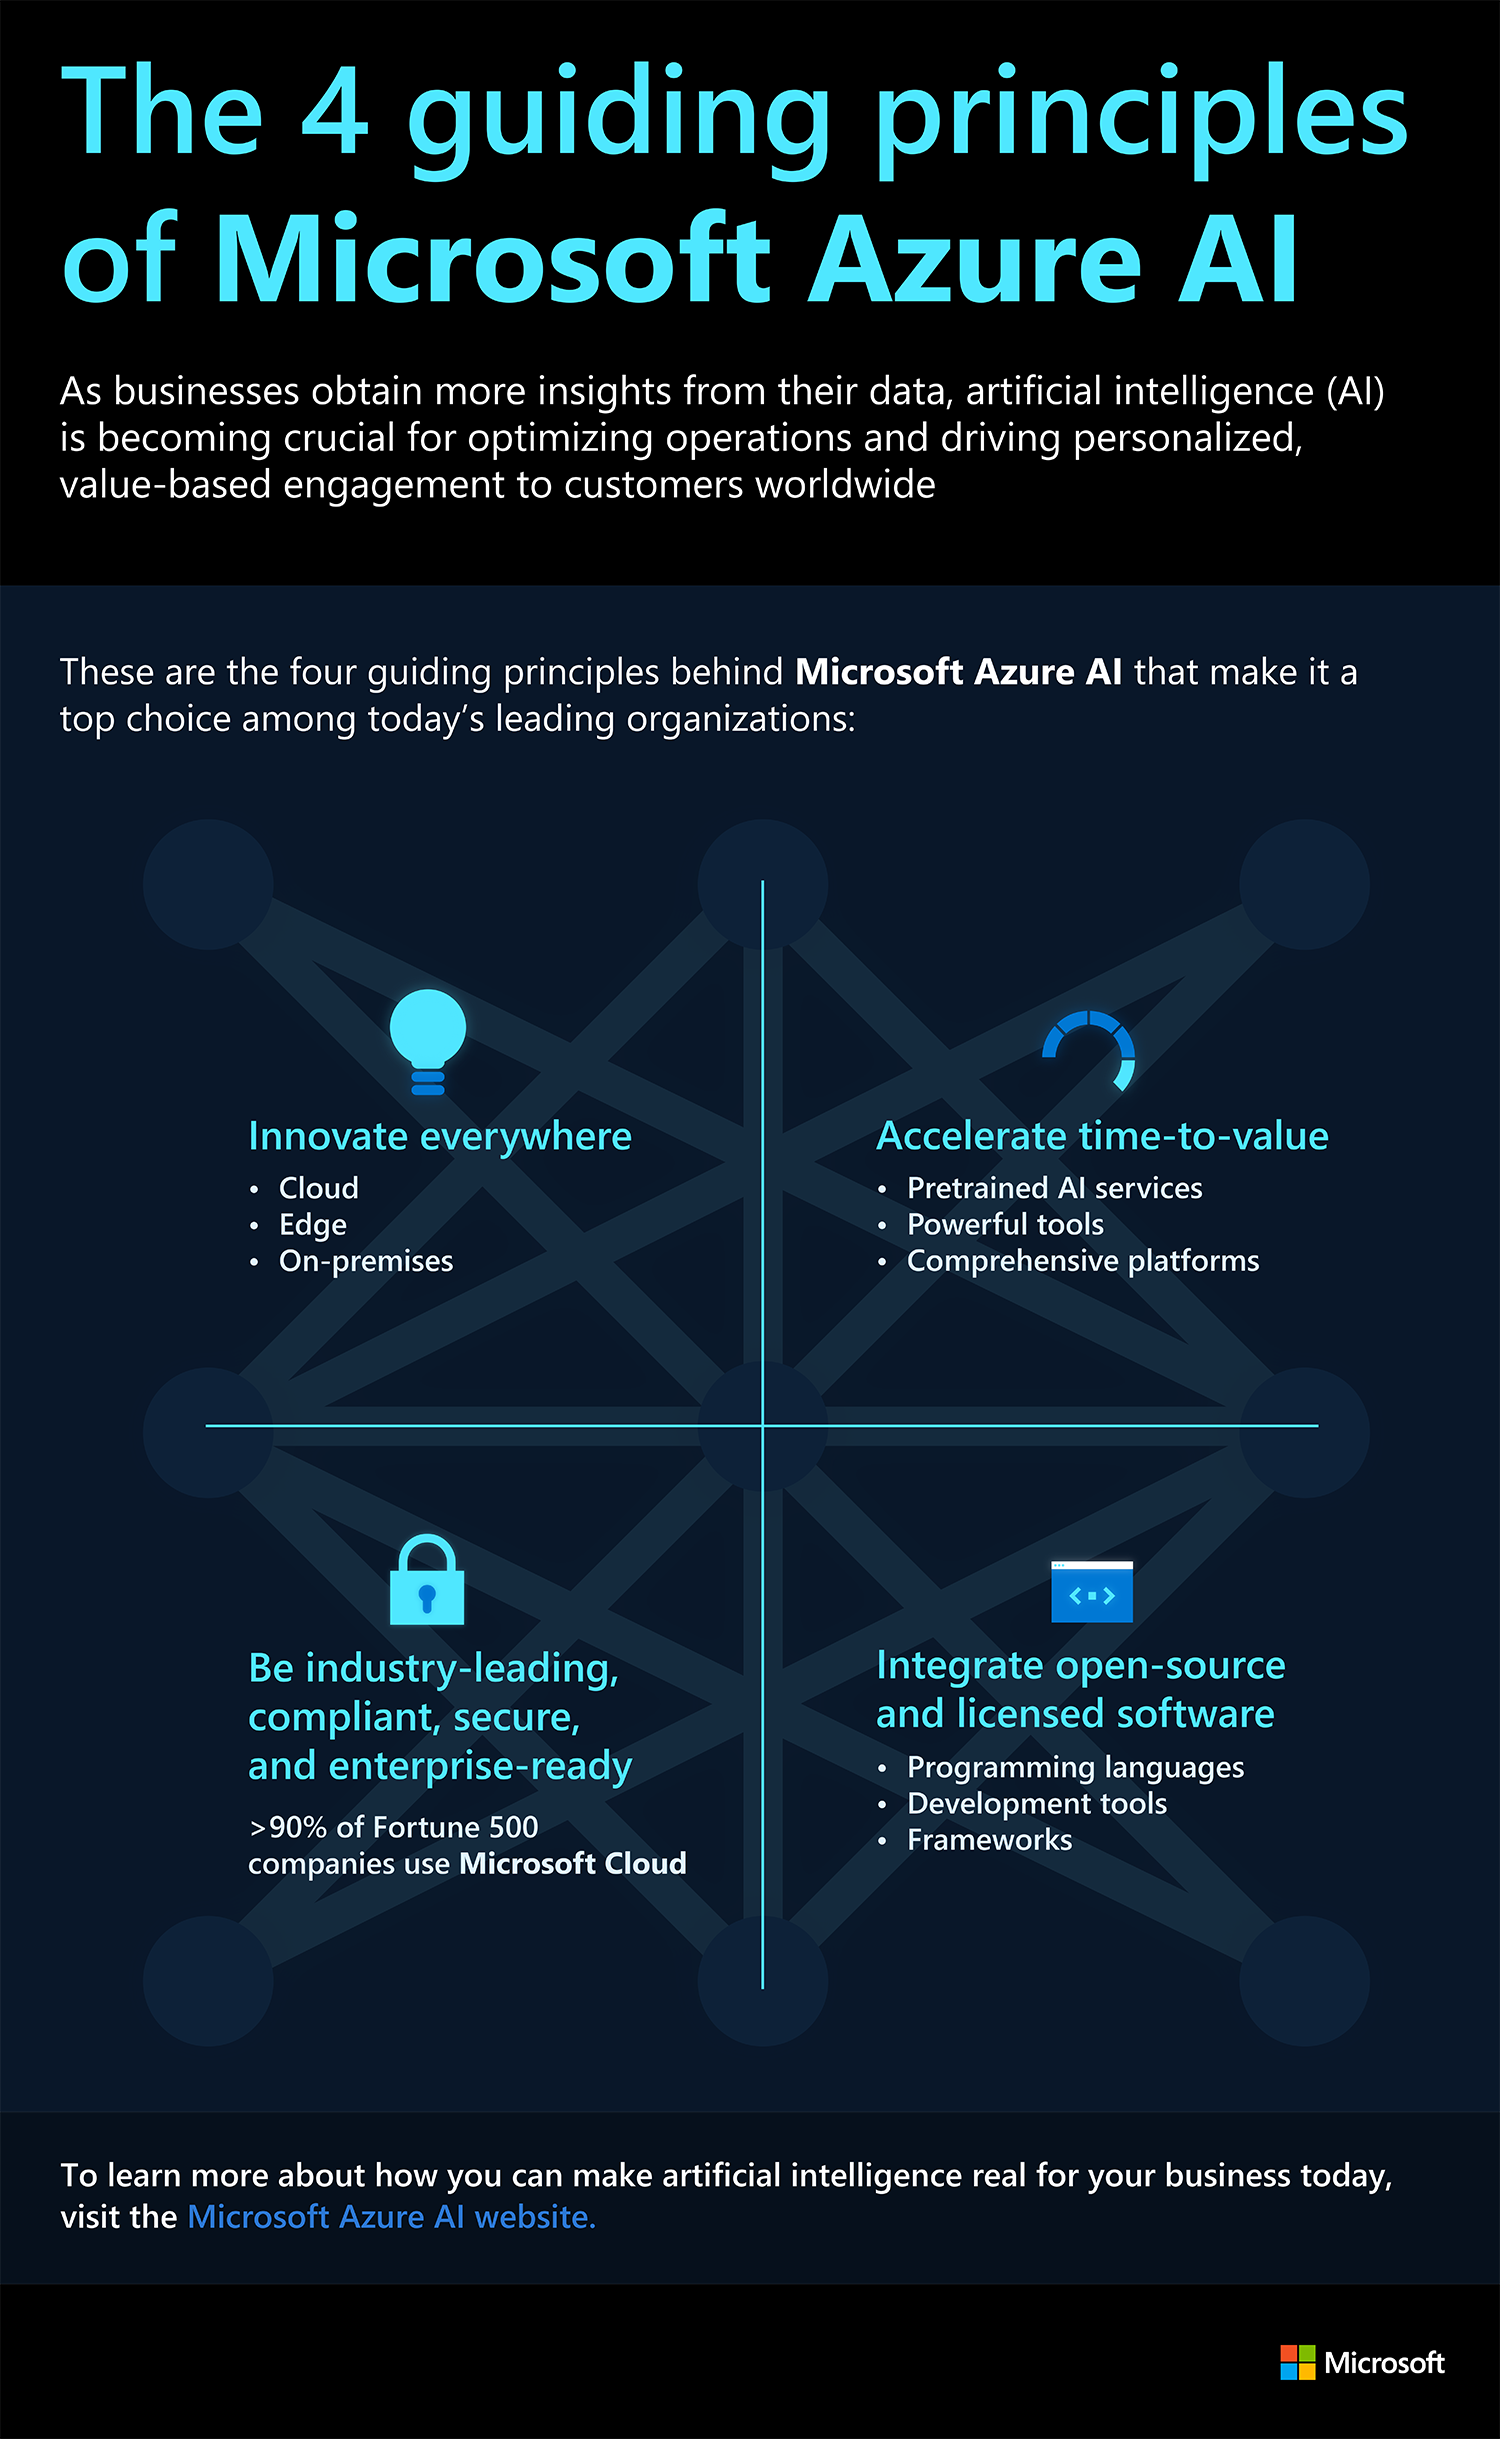
Without artificial intelligence (AI), organizing and extracting insights from vast amounts of enterprise data would be a nearly impossible task. Choosing the right AI capabilities is essential to successful initiatives. This infographic presents the four guiding principles behind Microsoft #Azure #AI and why it remains the top choice for today’s leading enterprises.

Would you like to leverage Azure AI for your business,? At CloudIQ Technologies, we have knowledgeable and professional team ready to help you transform massive amounts of raw information into meaningful insights for your business. Contact us today to learn more.

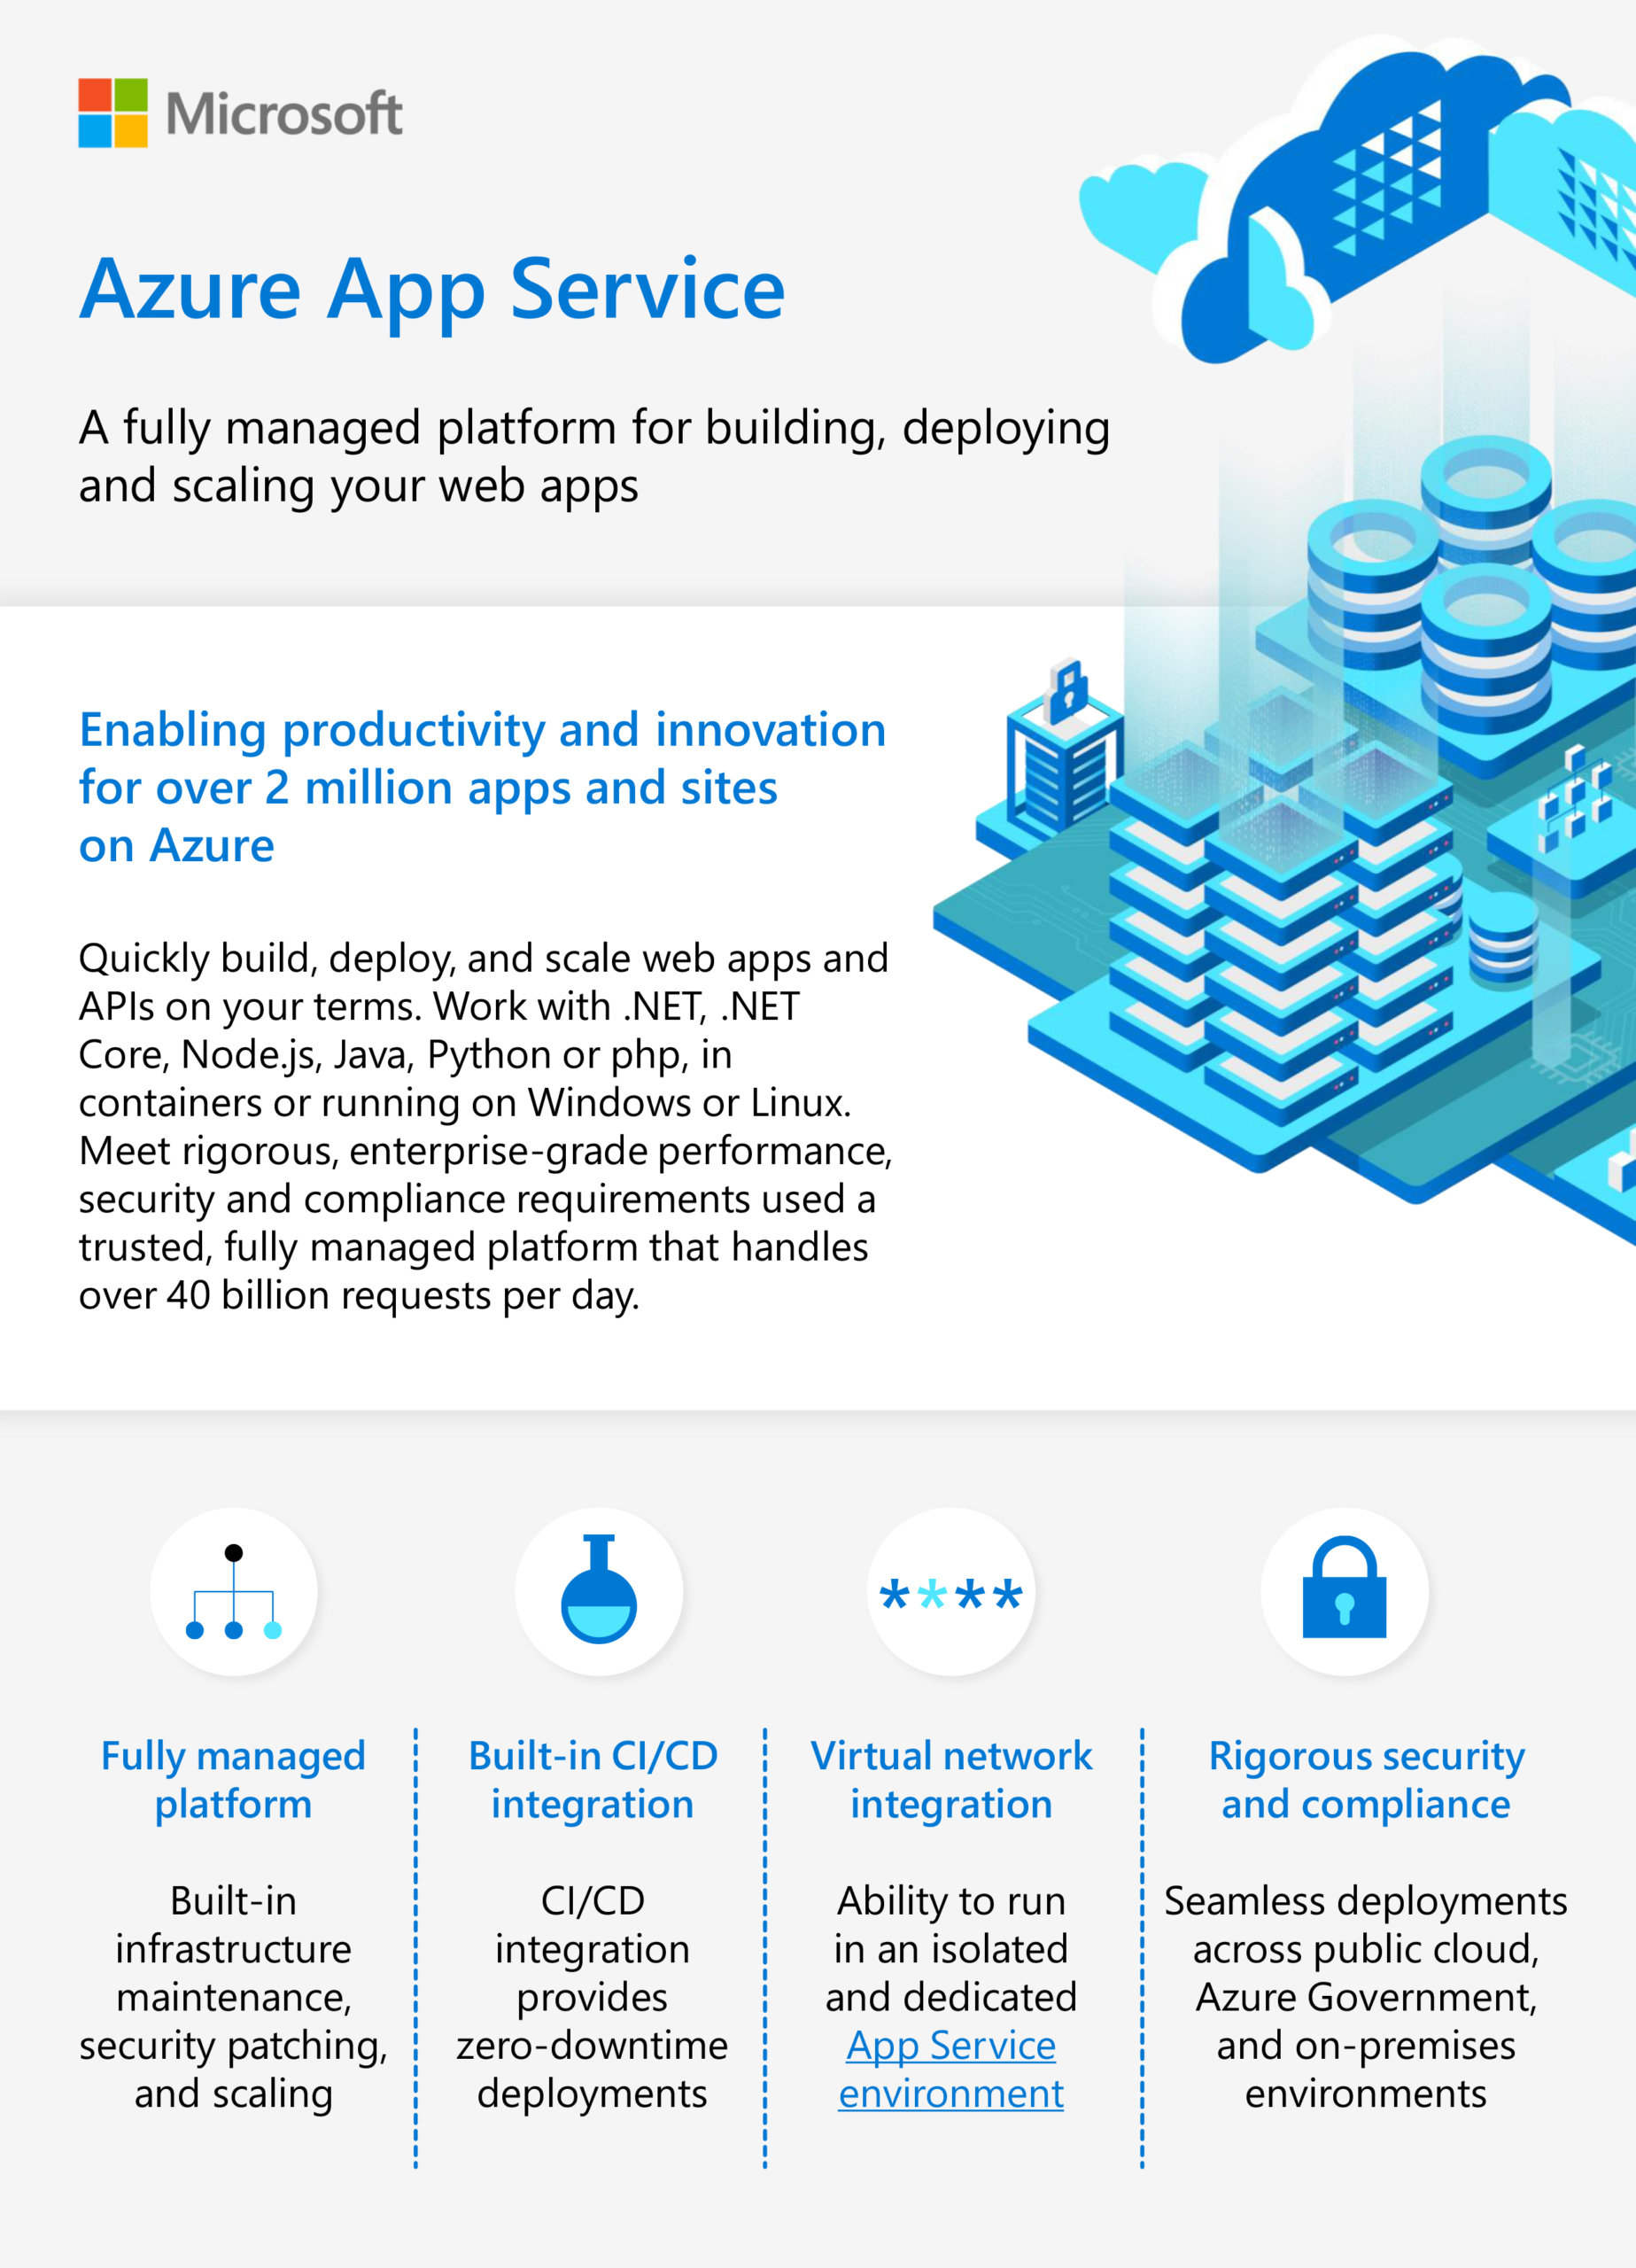
Have you been looking for a fully-managed, secure platform for your web apps? Azure App Service is built to help you build, deploy, and scale your web apps and APIs on your terms. Work with .NET, .NET Core, Node.js, Java, Python or php, in containers or running on Windows or Linux. Check out this infographic and contact CloudIQ Technologies to learn more.

Would you like to modernize your apps using Azure App Service? At CloudIQ Technologies, we have knowledgeable and professional team ready to help you. Contact us today to learn more.

Azure SQL Databases are intelligent and always up to date. It is the only cloud with evergreen SQL which never needs to be patched or updated. This infographic presents the benefits of Azure SQL Database and Azure Advance Threat Protection.

Would you like to migrate SQL Server databases to the Azure cloud,? At CloudIQ Technologies, we have knowledgeable and professional team ready to help address any of your IT infrastructure upgrade needs. Contact us today to learn more.

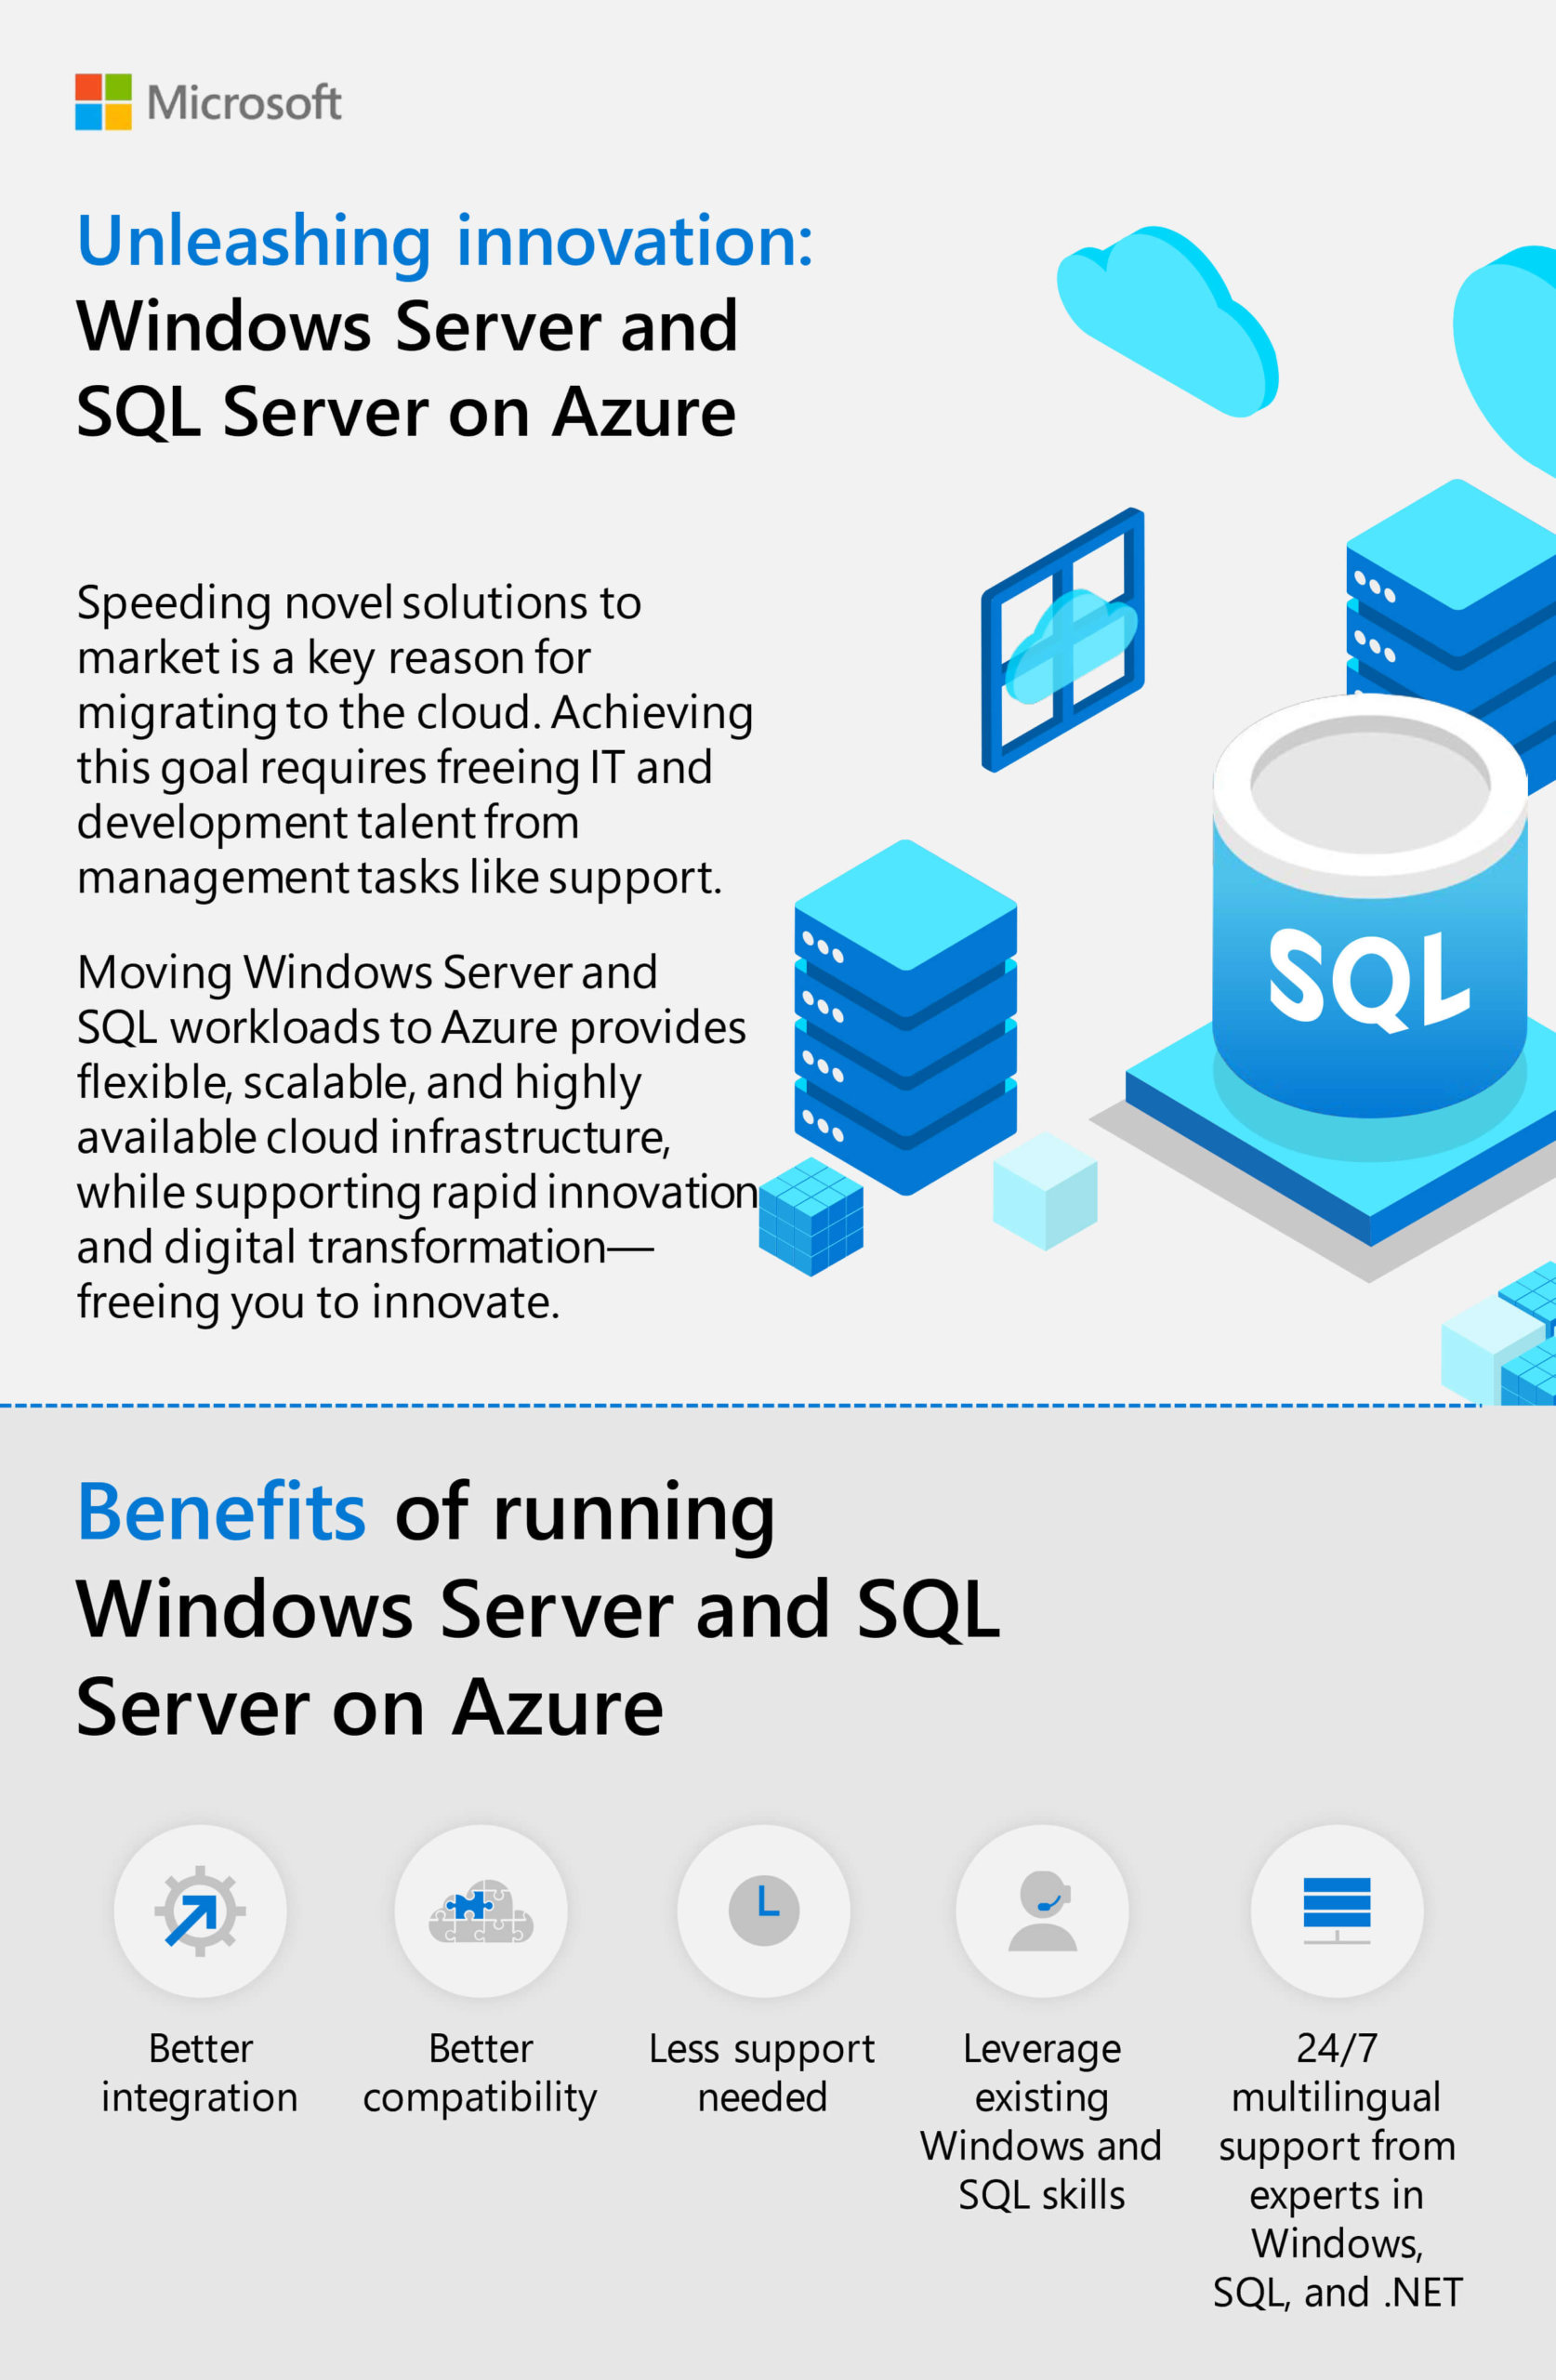
Moving Windows Server and SQL workloads to Azure provides flexible, scalable, and highly available cloud infrastructure. It also supports rapid innovation and digital transformation, freeing you to focus on your mission. This infographic presents the benefits of running Windows Server and SQL Server on Azure. 

Would you like to move your Windows Server and SQL workloads to Azure? At CloudIQ Technologies, we have knowledgeable and professional team ready to help address any of your IT infrastructure upgrade needs. Contact us today to learn more.

There are four different ways of accessing Azure Data Lake Storage Gen2 in Databricks. However, using the ADLS Gen2 storage account access key directly is the most straightforward option. Before we dive into the actual steps, here is a quick overview of the entire process

  • Understand the features of Azure Data Lake Storage (ADLS)
  • Create ADLS Gen 2 using Azure Portal
  • Use Microsoft Azure Storage Explorer
  • Create Databricks Workspace
  • Integrate ADLS with Databricks
  • Load Data into a Spark DataFrame from the Data Lake
  • Create a Table on Top of the Data in the Data Lake

Microsoft Azure Data Lake Storage (ADLS) is a fully managed, elastic, scalable, and secure file system that supports HDFS semantics and works with the Apache Hadoop ecosystem.  It is built for running large-scale analytics systems that require large computing capacity to process and analyze large amounts of data

Features:

Limitless storage

ADLS is suitable for storing all types of data coming from different sources like devices, applications, and much more. It also allows users to store relational and non-relational data. Additionally, it doesn’t require a schema to be defined before data is loaded into the store. ADLS can store virtually any size of data, and any number of files. Each ADLS file is sliced into blocks and these blocks are distributed across multiple data nodes. There is no limitation on the number of blocks and data nodes.

Auditing

ADLS creates audit logs for all operations performed in it.

Access Control

ADLS provides access control through the support of access control lists (ACL) on files and folders stored in its infrastructure. It also manages authentication through the integration of AAD based on OAuth tokens from supported identity providers.

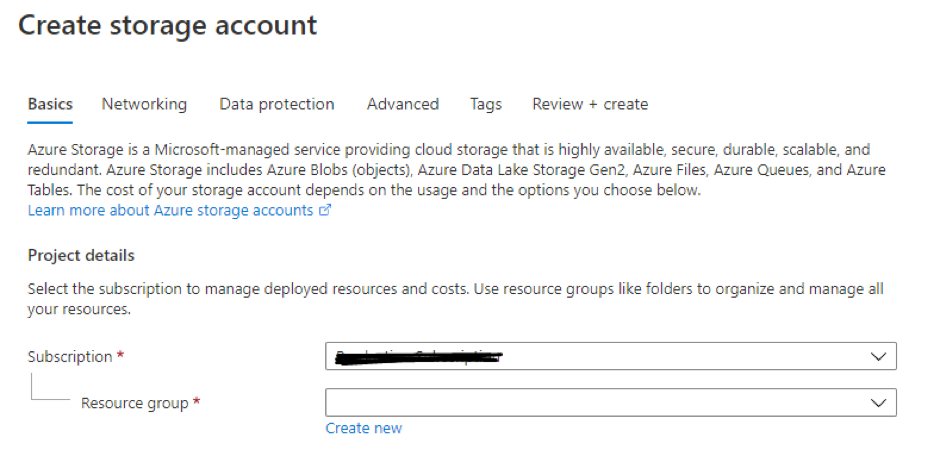
Create ADLS Gen2 using Portal:

  1. Login into the portal.
  2. Search for “Storage Account”
  3. Click “Add”

4. Choose Subscription and Resource Group.

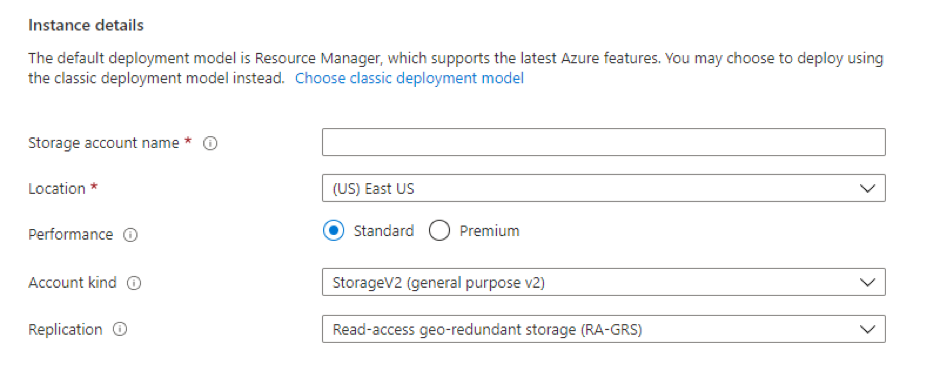
5. Give storage account name, location, kind, and replication.

6. In the Advanced Tab, set Hierarchical namespace to Enabled

7. Click “Review+Create”

Microsoft Azure Storage Explorer

Microsoft Azure Storage Explorer is a standalone app that makes it easy to work with Azure Storage data on Windows, macOS, and Linux.  Microsoft has also provided this functionality within the Azure portal which is currently in preview mode.1.

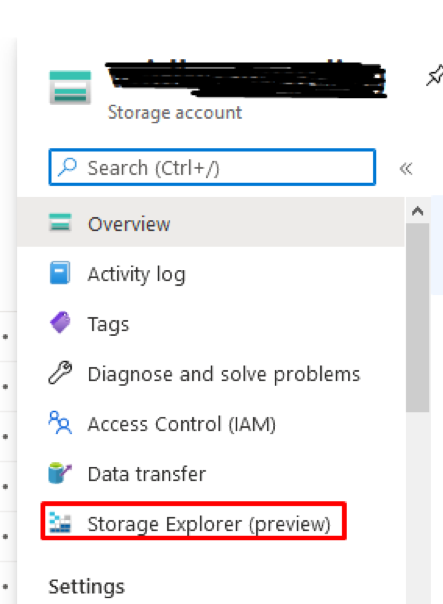
  1. Navigate back to your data lake resource in Azure and click ‘Storage Explorer (preview)’.

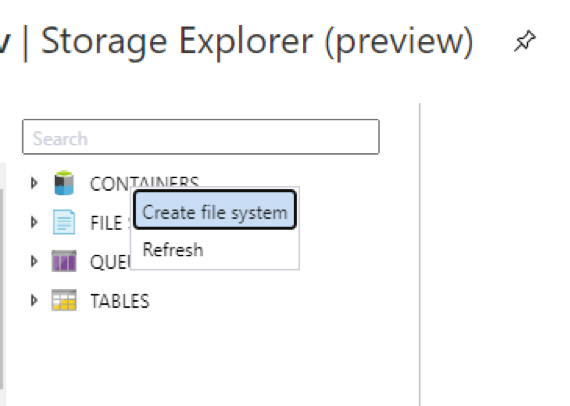
2. Right-click on ‘CONTAINERS’ and click ‘Create file system’. This will be the root path for our data lake.

3. Name the file system and click ‘OK’.

4. Now, click on the file system you just created and click ‘New Folder’. This is how we will create our base data lake zones. Create folders.

5. To upload data to the data lake, you will need to install Azure Data Lake explorer using the following link.

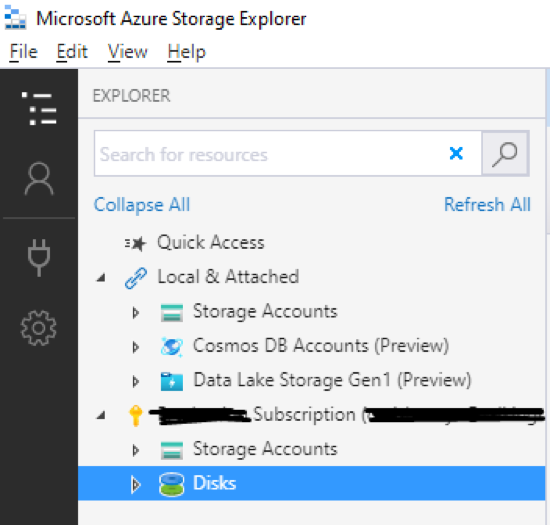
6. Once you install the program, click ‘Add an account’ in the top left-hand corner, log in with your Azure credentials, keep your subscriptions selected, and click ‘Apply’.

7. Navigate down the tree in the explorer panel on the left-hand side until you get to the file system you created, double click on it. Then navigate into the folder. There you can upload/ download files from your local system.

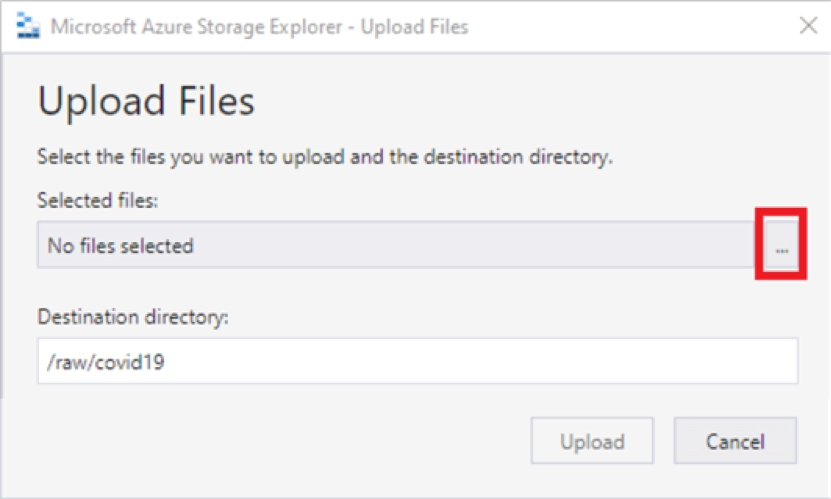
8. Click “Upload” > “Upload Files”. You can get sample data set from here.

Sample Folder structure:

Create Databricks Workspace

  1. On the Azure home screen, click ‘Create a Resource’

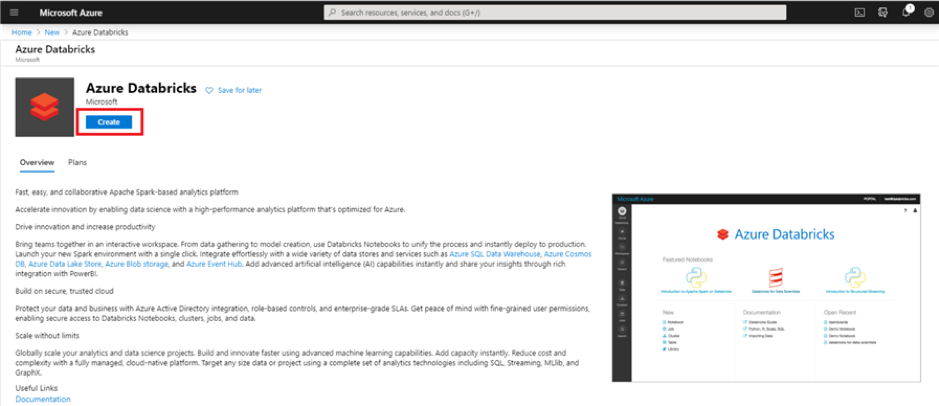
2. In the ‘Search the Marketplace’ search bar, type ‘Databricks’ and you should see ‘Azure Databricks’ pop up as an option. Click that option.

3. Click ‘Create’ to begin creating your workspace.

4. Use the same resource group you created or selected earlier. Then, enter a workspace name.

5. Select ‘Review and Create’.

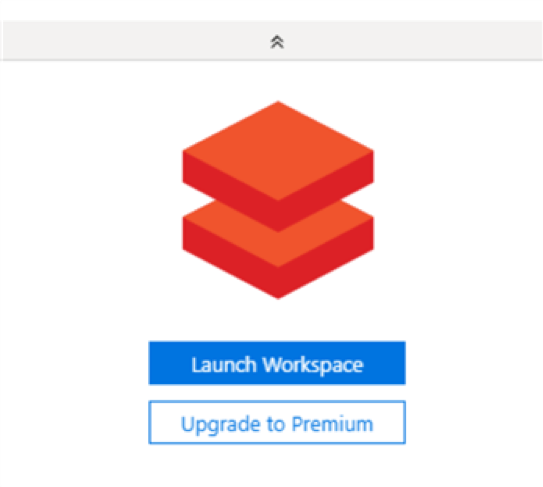
6. Once the deployment is complete, click ‘Go to resource’ and then click ‘Launch Workspace’ to get into the Databricks workspace.

Integrate ADLS with Databricks:

There are four ways of accessing Azure Data Lake Storage Gen2 in Databricks:

  1. Mount an Azure Data Lake Storage Gen2 filesystem to DBFS using a service principal and OAuth 2.0.
  2. Use a service principal directly.
  3. Use the Azure Data Lake Storage Gen2 storage account access key directly.
  4. Pass your Azure Active Directory credentials, also known as a credential passthrough.

Let’s use option 3.

1. This option is the most straightforward and requires you to run the command, setting the data lake context at the start of every notebook session. Databricks Secrets are used when setting all these configurations

2. To set the data lake context, create a new Python notebook, and paste the following code into the first cell:

spark.conf.set(
"fs.azure.account.key.<storage-account-name>.dfs.core.windows.net",
""
)

3. Replace ‘<storage-account-name>’ with your storage account name.

4. In between the double quotes on the third line, we will be pasting in an access key for the storage account that we grab from Azure

5. Navigate to your storage account in the Azure Portal and click on ‘Access keys’ under ‘Settings’.

6. Click the copy button, and paste the key1 Key in between the double quotes in your cell

7. Attach your notebook to the running cluster and execute the cell. If it worked, you should see the following:

8. If your cluster is shut down, or if you detach the notebook from a cluster, you will have to re-run this cell to access the data.

9. Copy the below command in a new cell, filling in your relevant details, and you should see a list containing the file you updated.

dbutils.fs.ls("abfss://<file-system-name>@<storage-account-
name>.dfs.core.windows.net/<directory-name>")

Load Data into a Spark DataFrame from the Data Lake

Towards the end of the Error! Reference source not found. section, we uploaded a sample CSV file into ADLS.  We will now see how we can read this CSV file from Spark.

We can get the file location from the dbutils.fs.ls command we ran earlier – see the full path as the output.

Run the command given below:

#set the data lake file location:
file_location = "abfss://[email protected]/raw/covid
19/johns-hopkins-covid-19-daily-dashboard-cases-by-states.csv"
 
#read in the data to dataframe df
df = spark.read.format("csv").option("inferSchema", "true").option("header",
"true").option("delimiter",",").load(file_location)
 
#display the dataframe
display(df)

Create a table on top of the data in the data lake

In the previous section, we loaded the data from a CSV file to a DataFrame so that it can be accessed using python spark API.  Now, we will create a Hive table in spark with data in an external location (ADLS), so that the data can be access using SQL instead of python code.

In a new cell, copy the following command:

%sql
CREATE DATABASE covid_researc

Next, create the table pointing to the proper location in the data lake.

%sql
CREATE TABLE IF NOT EXISTS covid_research.covid_data
USING CSV
LOCATION 'abfss://[email protected]/raw/covid
19/johns-hopkins-covid-19-daily-dashboard-cases-by-states.csv'

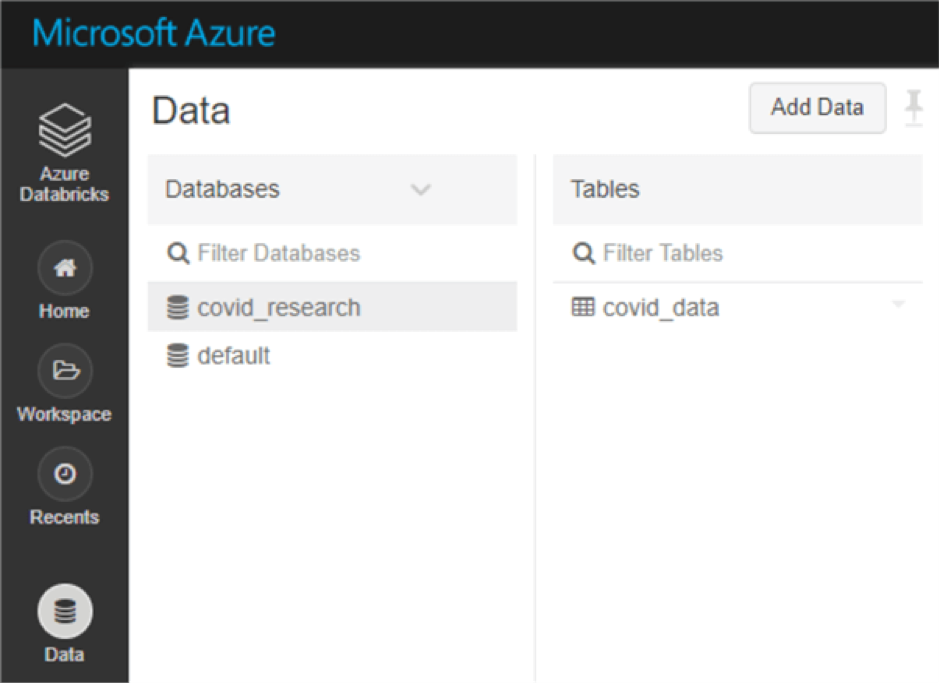
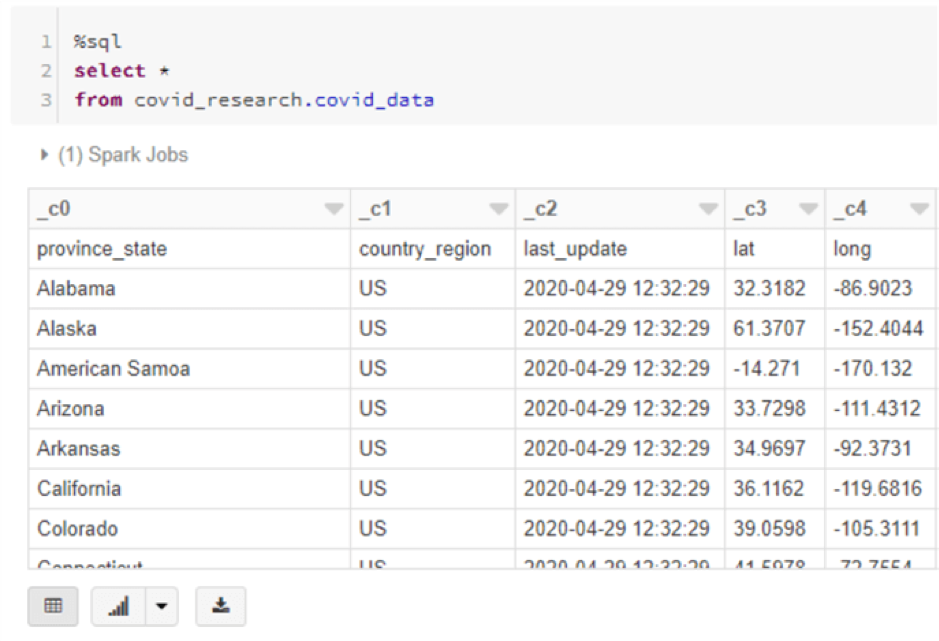
 You should see the table appear in the data tab on the left-hand navigation pane.

Run a select statement against the table.

%sql
CREATE TABLE IF NOT EXISTS covid_research.covid_data
USING CSV
LOCATION 'abfss://[email protected]/raw/covid1
9/johns-hopkins-covid-19-daily-dashboard-cases-by-states.csv'
OPTIONS (header "true", inferSchema "true")

That concludes our step-by-step guide on accessing Azure Data Lake Storage Gen2 in Databricks, using the ADLS Gen2 storage account access key directly.

Hope you found this guide useful, stay tuned for more.

The scalability, flexibility, cost-efficiency, and improved performance that comes with moving to the cloud is becoming too attractive for companies to ignore them. Many organizations have started moving to the cloud as a cost-effective option to manage their IT portfolio and avoid expensive Capex for the purchase of new servers and remove the complexities in managing on-premises architecture.

Irrespective of a company’s size, migrating to the cloud is certainly quite an undertaking. Fortunately, Microsoft has created a unique platform with a range of tools to help make the migration fast and smooth, while minimizing the risk and impact to your business.

Microsoft Azure is one of the leading cloud computing service providers that allows businesses to use cloud resources on a pay per use model, therefore you can pay for only what you need and how long you need it. Azure provides multiple options right from Infrastructure as a Service (IaaS) to Platform as a Service (PaaS) to Software as a Service (SaaS), so you can choose from a simple lift and shift approach to a more complex application modernization approach.

The migration journey begins with an Assessment of your current setup. There are tools like Azure Migrate that Azure provides for this purpose and additionally you can leverage other assessment tools from Azure migration partner ecosystem. Azure Migrate provides a centralized hub to assess and migrate to Azure on-premise servers, infrastructures, applications, and data. With Azure, you can also assess how your workloads will perform, plan, and implement your migration strategy accordingly.

5 Azure Migration Strategies

Here are five strategies that are adopted widely for migrating an application to Azure cloud.

1. Rehosting

Commonly known as “lift and shift”, this is an approach to migrate applications from an on-premise environment to the cloud with no changes to the underlying applications. This is the most popular migration approach as it allows quick migration with little risk of disruption by employing real-time replication during the transition process.

2. Refactoring

This is also known as “repacking”. It involves making small changes to the code and configuration of the application to ensure they are more compatible with the cloud so you can connect them easily to Azure-native infrastructure. This can improve the scalability and maximize the operational cost-efficiency of the platform.

3. Rearchitecting

Also known as “redesigning”, this strategy involves modifying or extending the code base of an application to optimize it to run on Azure. Rearchitecting is a time-consuming migration approach, but still, it offers infinite scalability.

4. Rebuilding

This strategy involves discarding the old application and rebuilding an application or workload from the ground up using the Azure Platform as a Service (PaaS). In this migration strategy, you manage the applications and services you develop, while Azure manages the platform and infrastructure required to run it.

5. Replacing

Under this approach, all the underlying infrastructure, middleware, application software, and application data are in the cloud and managed by Azure in Microsoft datacenters. This is used for greater efficiency and scalability.

3-Step Migration Process

Once you decide on your migration approach, the actual migration to the cloud is a 3-step process (Assess – Migrate – Optimize). Now before you get started with the migration there are a few preliminary considerations to ensure your cloud environment is ready to receive your workloads. You need to ensure that your virtual data center in the cloud contains the elements that are comparable to your on-premises environment. Building the virtual data center in the cloud is a streamlined process and it includes the following

1. Identity

To ensure authenticated access to users between your on-premises environment and workloads that you have migrated to the cloud, you need to invest in a built-in identity management solution. For this purpose, you can use the Azure Active Directory (Azure AD) or other similar solutions.

2. Storage

Migrating to the cloud requires a storage platform that meets the performance needs of your migrated workloads. You can choose from different storage types and configure exact storage requirements based on workloads to ensure security and reliability. You just need to enter a few details to get the right storage for your migration project.

3. Networking

Networking is the backbone of the data center. When migrating to the cloud, you need to keep the applications in the same subnets and IP address ranges to ensure a seamless migration.  You can create a virtual network to maintain the same performance and stability you had in the on-premise data center.

4. Connectivity

During migration, you’ll transfer a large amount of data to the cloud. So it would be wise to opt for a dedicated connectivity option to help with smooth data transfer and have the best user experience. For this purpose, you can use Azure ExpressRoute as it helps in a faster, private connection to Azure and ensures performance and security.

Now it’s time to begin your migration journey to the cloud.

Migration Phase 1: Assessment

Now that you have a better understanding of Azure and how it fits into your migration strategy, it’s time to assess your existing infrastructure. Here are four steps to do that

1. Identification of application and server dependencies

Begin with inventory and assessment of on-premises IT resources to identify opportunities to optimize the IT environment and prioritize which applications and workloads are ideal for migration. Determining your priorities and objectives early can help you have a seamless migration process.

2. Assessment of on-premises applications and servers

Your organization may run hundreds or thousands of servers and virtual machines. You need consolidated planning and a perfect tool to shift them to the cloud. Microsoft offers Azure Migrate service to provide automation for the assessment of on-premises workloads. Ultimately, the goal of this assessment phase is to collect server and application information, including configuration and usage.

3. Configuration analysis

Configuration analysis will help you understand which of your workloads can be migrated with no modifications, which ones require a few modifications, and which workloads are incompatible with the current installation. Essentially this step helps you ensure the proper functioning of the workloads on the cloud.

4. Cost planning

The final step of the assessment phase is to collect resource usage such as CPU, memory, and storage to forecast costs and expenditures. This helps in ascertaining the actual usage of your workload and ensure that your choice meets both performance and economic targets.

Migration Phase 2: Execute Migration

After you’ve completed discovery and assessment, now it’s time to prepare for the next step – migration.  The lift-and-shift method most often employed for server or VM migration is real-time replication, due to its flexibility and capability in staged migration.

1. Real-time Replication

This involves creating a copy of the workload in the cloud and allowing asynchronous replication to keep the copy and the workload in sync. Replication also lets groups of virtual machines be connected to the cloud. Real-time replication also allows the old workload to remain online and accessible during the migration to ensure zero disruptions.

2. Testing

Once the replication is complete, start your application or workloads using an isolated environment that mimics the cloud production environment. It lets you test the application without impacting the on-premise as well as cloud production systems. When you’re fully satisfied, it’s time to perform the final migration.

Migration Phase 3: Optimize

Once the migration phase is complete, you need to ensure a seamless transition of operating workloads in the cloud. This is what the optimize phase is all about.

1. Secure cloud resources

Know the security controls and the capabilities of the new cloud-based application, to ensure that the security measures are working, and responding properly. You should become familiar with the capabilities of the Azure Security Center like centralized policy management, continuous security assessment, actionable recommendations, and more.

2. Protecting Data

Ensure that the workloads and data are having a proper backup, disaster recovery, encryption, and other measures to protect your business from risks. Azure offers multiple mechanisms like Azure disk encryption, Azure Backup, and Azure Site Recovery to protect your data.

3. Monitoring Cloud Health

Azure offers many monitoring services to ensure you have full visibility into your current system status and get unique insights into your applications and infrastructure. The basic monitoring services include Azure Monitor, Service Health, and Azure Advisor. A few of the premium monitoring services include Application Insights, Azure Log Analytics, and Network Watcher.

There are many options and reasons for migrating workloads to Azure.

With this straightforward guide, migration to Azure wouldn’t be a complex task anymore. By having a proper plan and mapping out the key objectives, you can ensure a successful Azure migration.

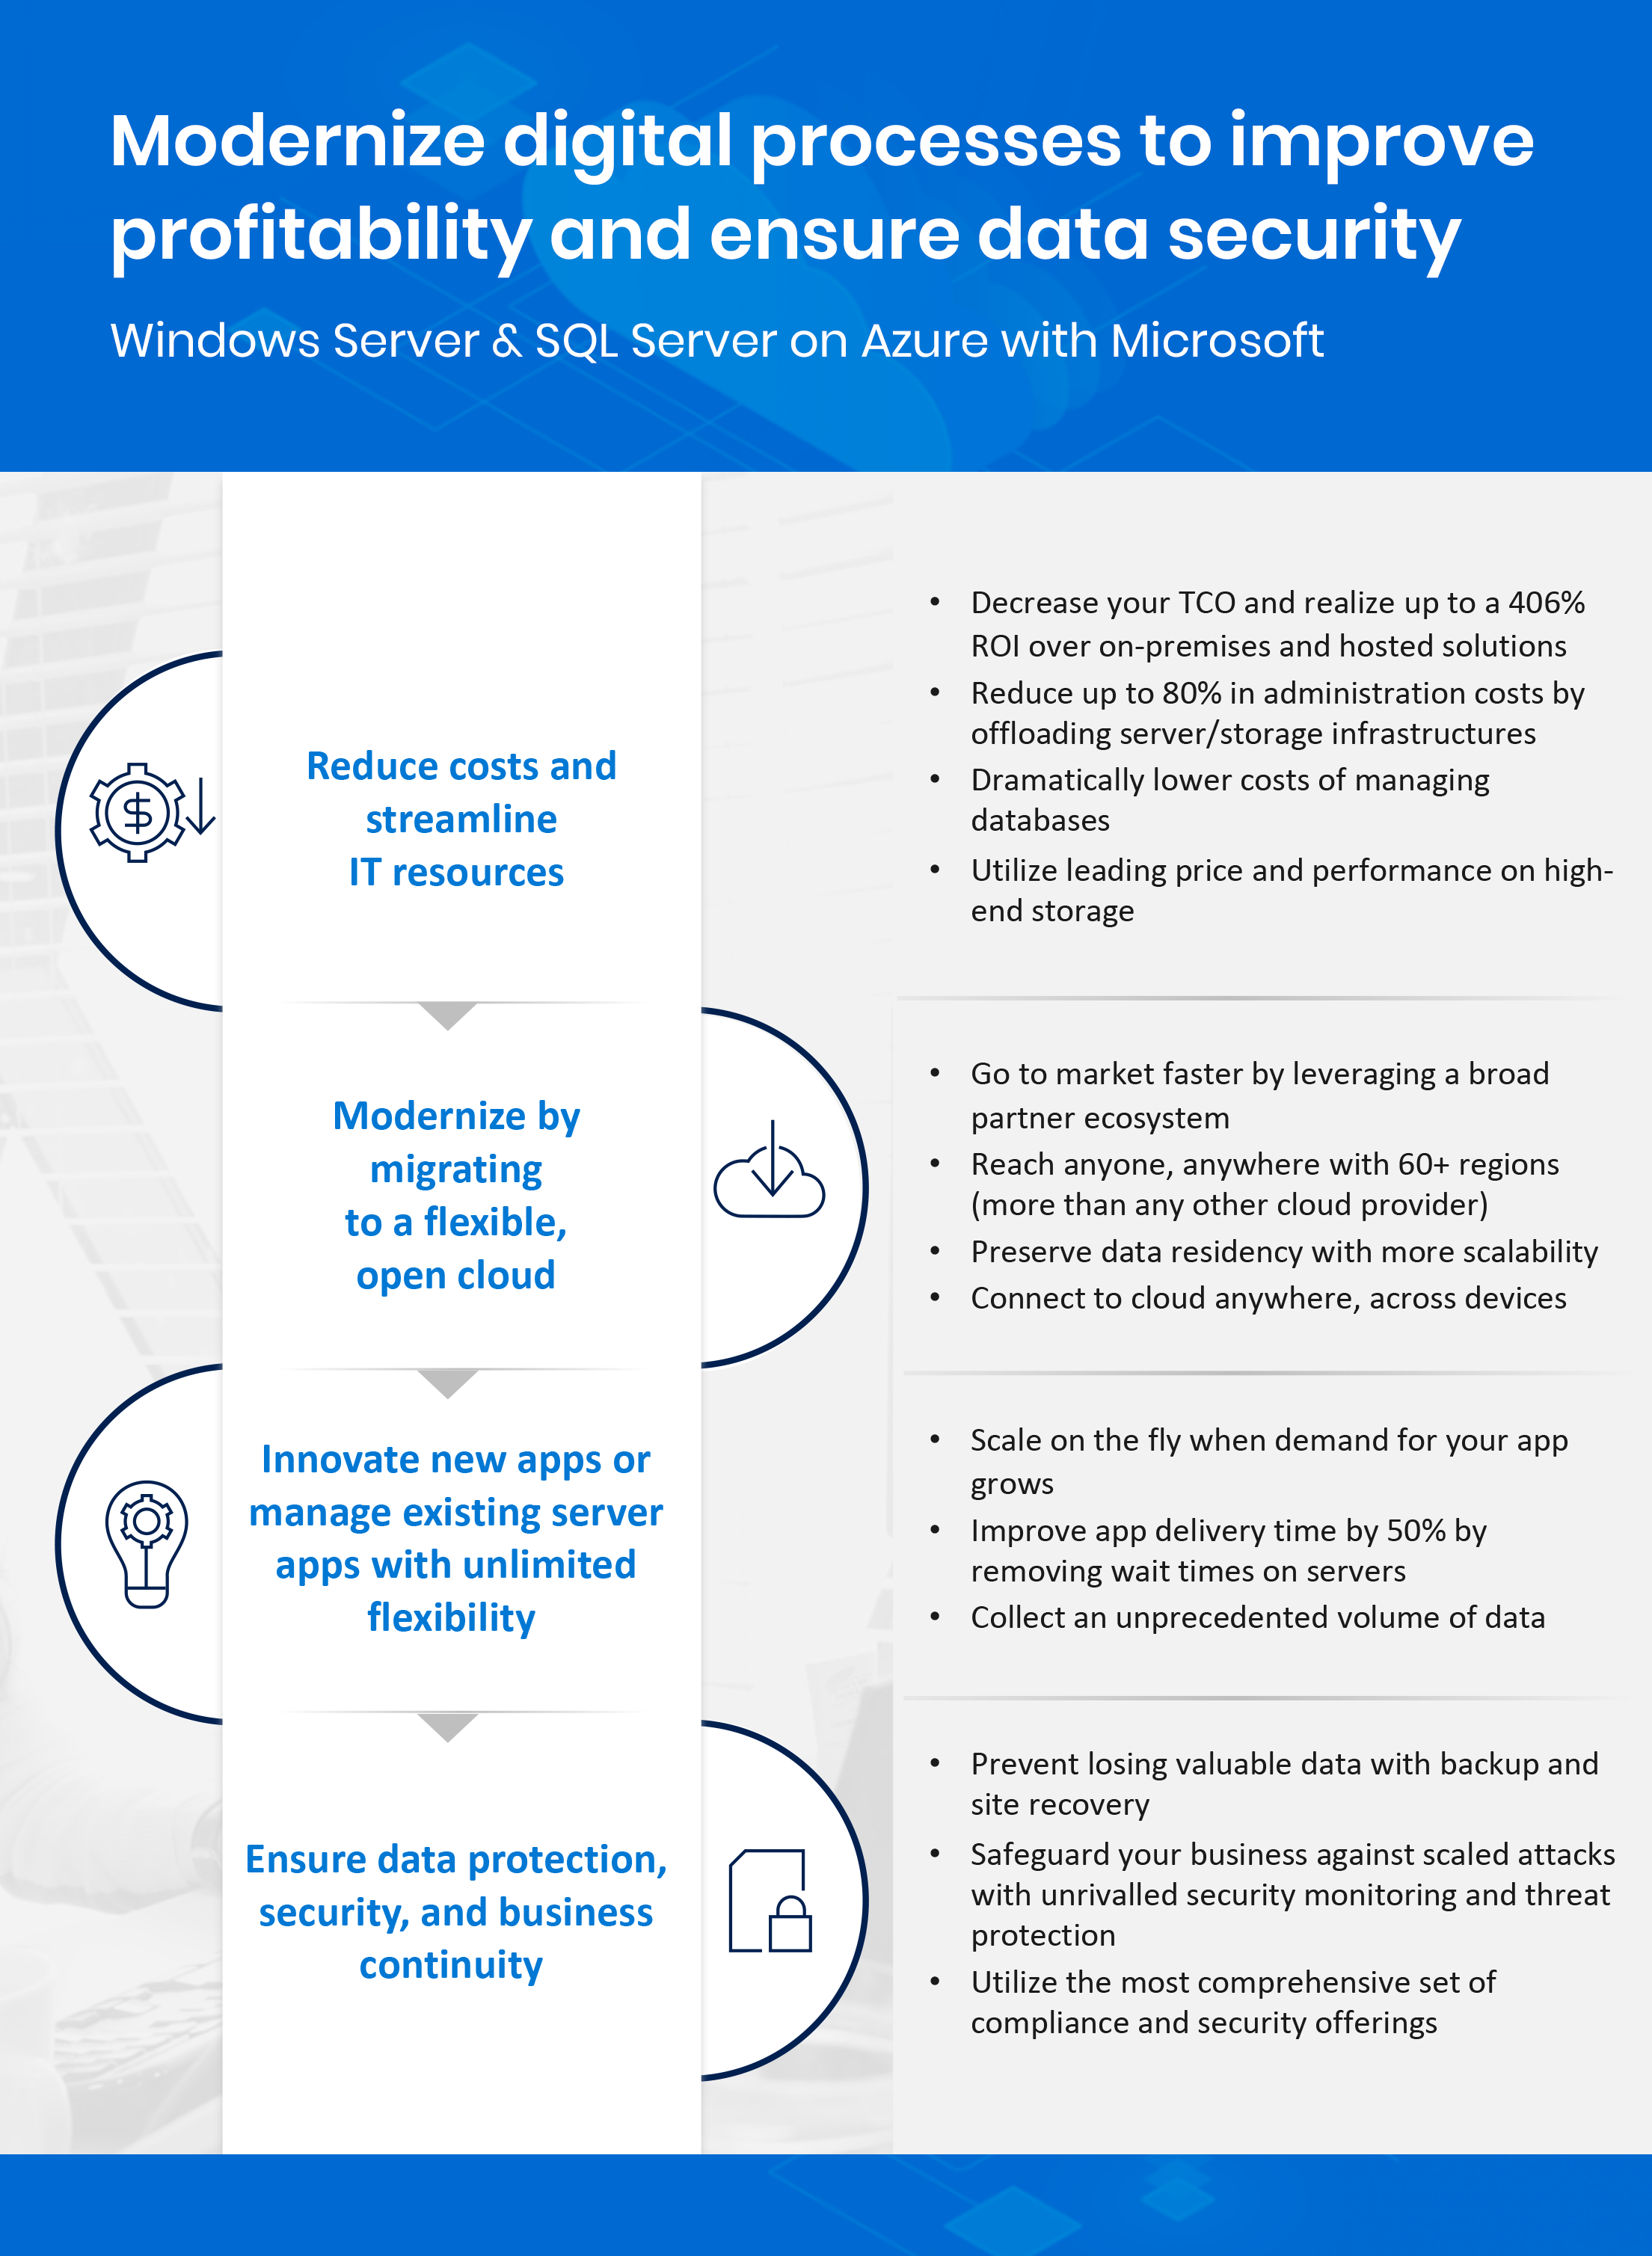
Want to know the key benefits of using Windows Server and SQL Server with Microsoft Azure? Here are four of them right from reducing costs and streamlining IT resources; modernizing by migrating to a flexible, open cloud; innovating new apps or managing existing server apps with unlimited flexibility; and ensuring data protection, security, and business continuity.

Would you like to modernize digital processes to improve profitability and ensure data security? At CloudIQ Technologies, we have knowledgeable and professional team ready to help you. Contact us today to learn more.

Azure Databricks provides comprehensive end-to-end diagnostic logs of activities performed by Azure Databricks users, allowing your enterprise to monitor detailed Azure Databricks usage patterns.

In this article, we’re going to look at sending the logs of Azure Databricks workspace to log analytics workspace using diagnostics settings present in the Databricks workspace.

Here are the pre-requisites and steps to enable diagnostics setting for Azure Databricks

Pre-requisites:
  1. User with owner or contributor access where the Databricks workspace is deployed.
  2. Databricks workspace. The diagnostics logging for Azure Databricks service is available only for the Premium plan.
Steps:
  1. Login to Azure portal.
  2. Select the Databricks workspace.

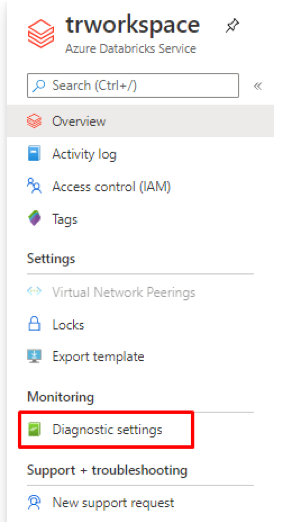
3. Select the diagnostics settings.

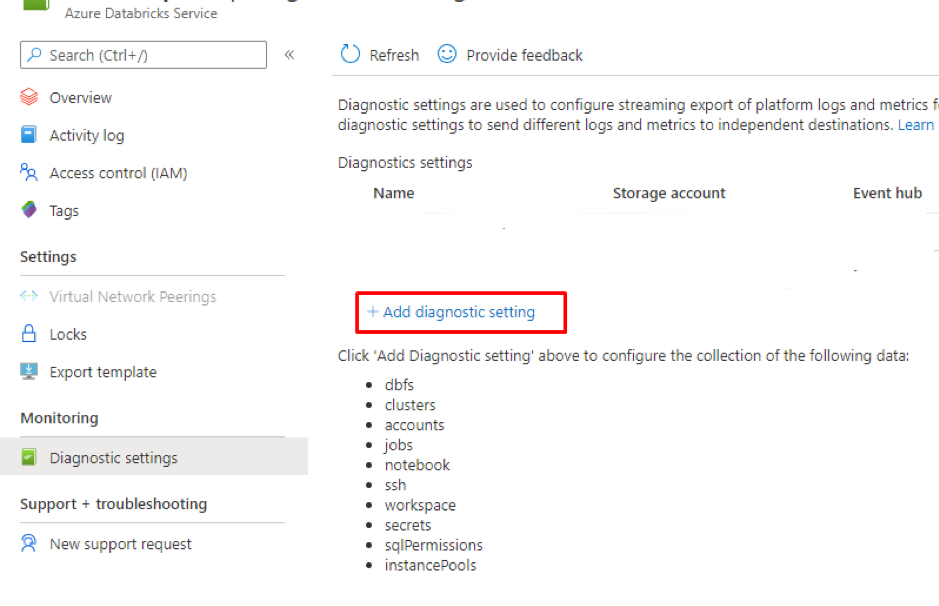
4. Now click “+ Add Diagnostics Settings”.

5. Azure Databricks provides diagnostic logs for the following services:

  • DBFS
  • Clusters
  • Pools
  • Accounts
  • Jobs
  • Notebook
  • SSH
  • Workspace
  • Secrets
  • SQL Permissions

6. Here we are going to send the logs to the log analytics workspace.

7. Select all the logs you want and send them to log analytics. Here we’re sending cluster logs.

8. Click Save.

9. Allow some time to ingest the logs to log analytics workspace.

10. Now go to the log analytics workspace where the diagnostics are configured.

11. Select logs. Now using KQL we can query our data sent from the Databricks workspace.

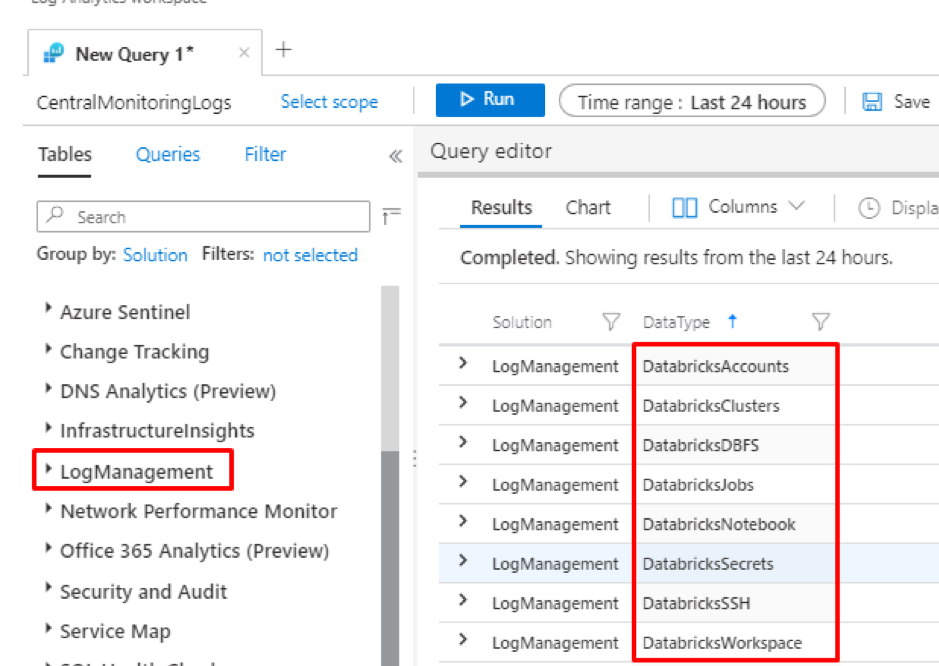
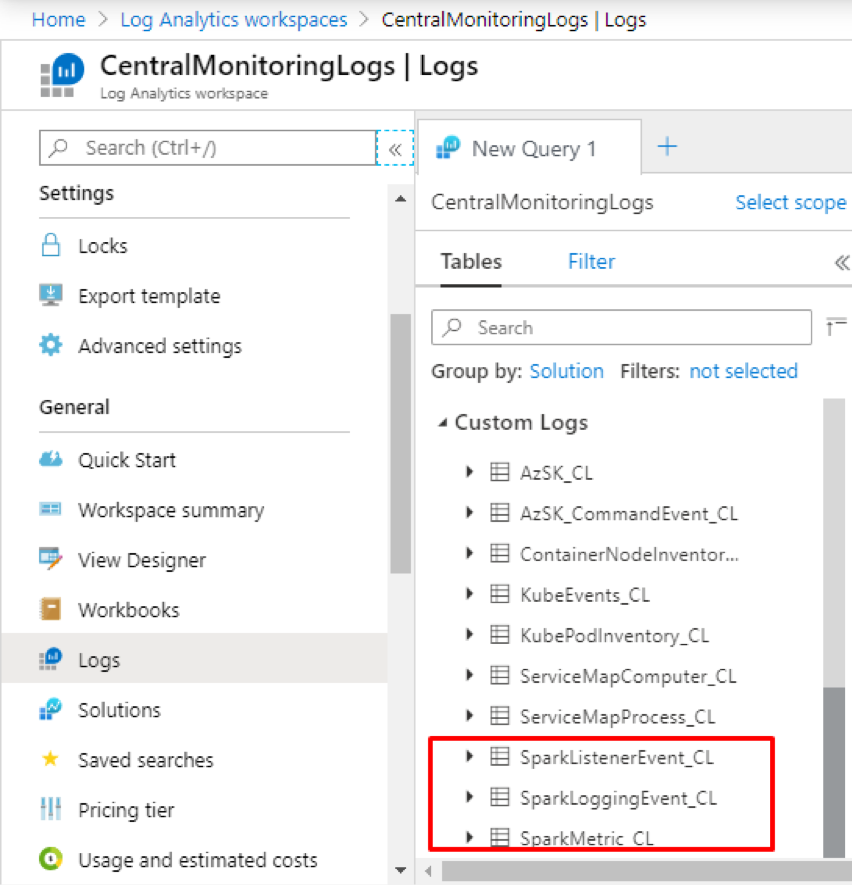
12. The Databricks log tables are found under the LogManagement category.

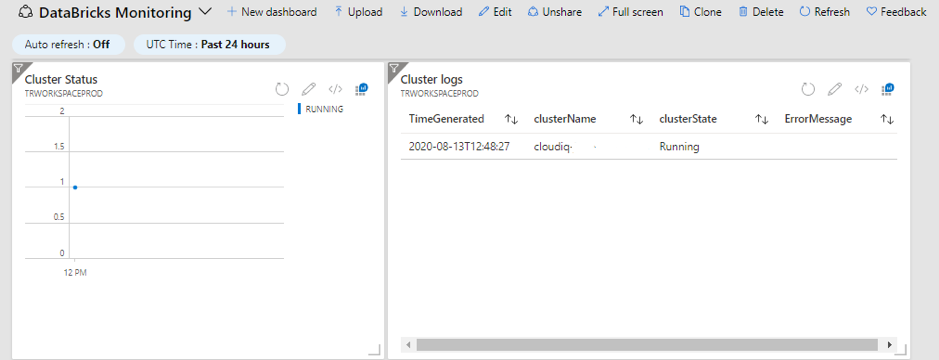
Databricks Monitoring Dashboard

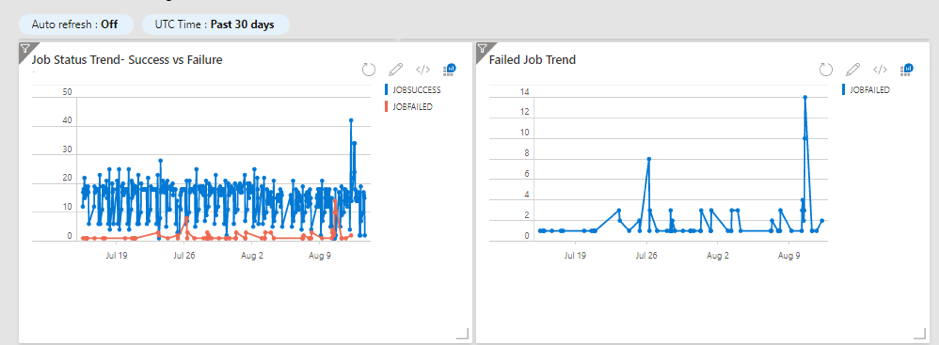
Here is the simple Databricks Monitoring dashboard we created for

  • Cluster availability
  • Failed job trend
  • Success vs failed job trend

We hope this article helps you set up the right configurations to sending the logs of Azure Databricks workspace to log analytics workspace and build the Databricks monitoring dashboard.

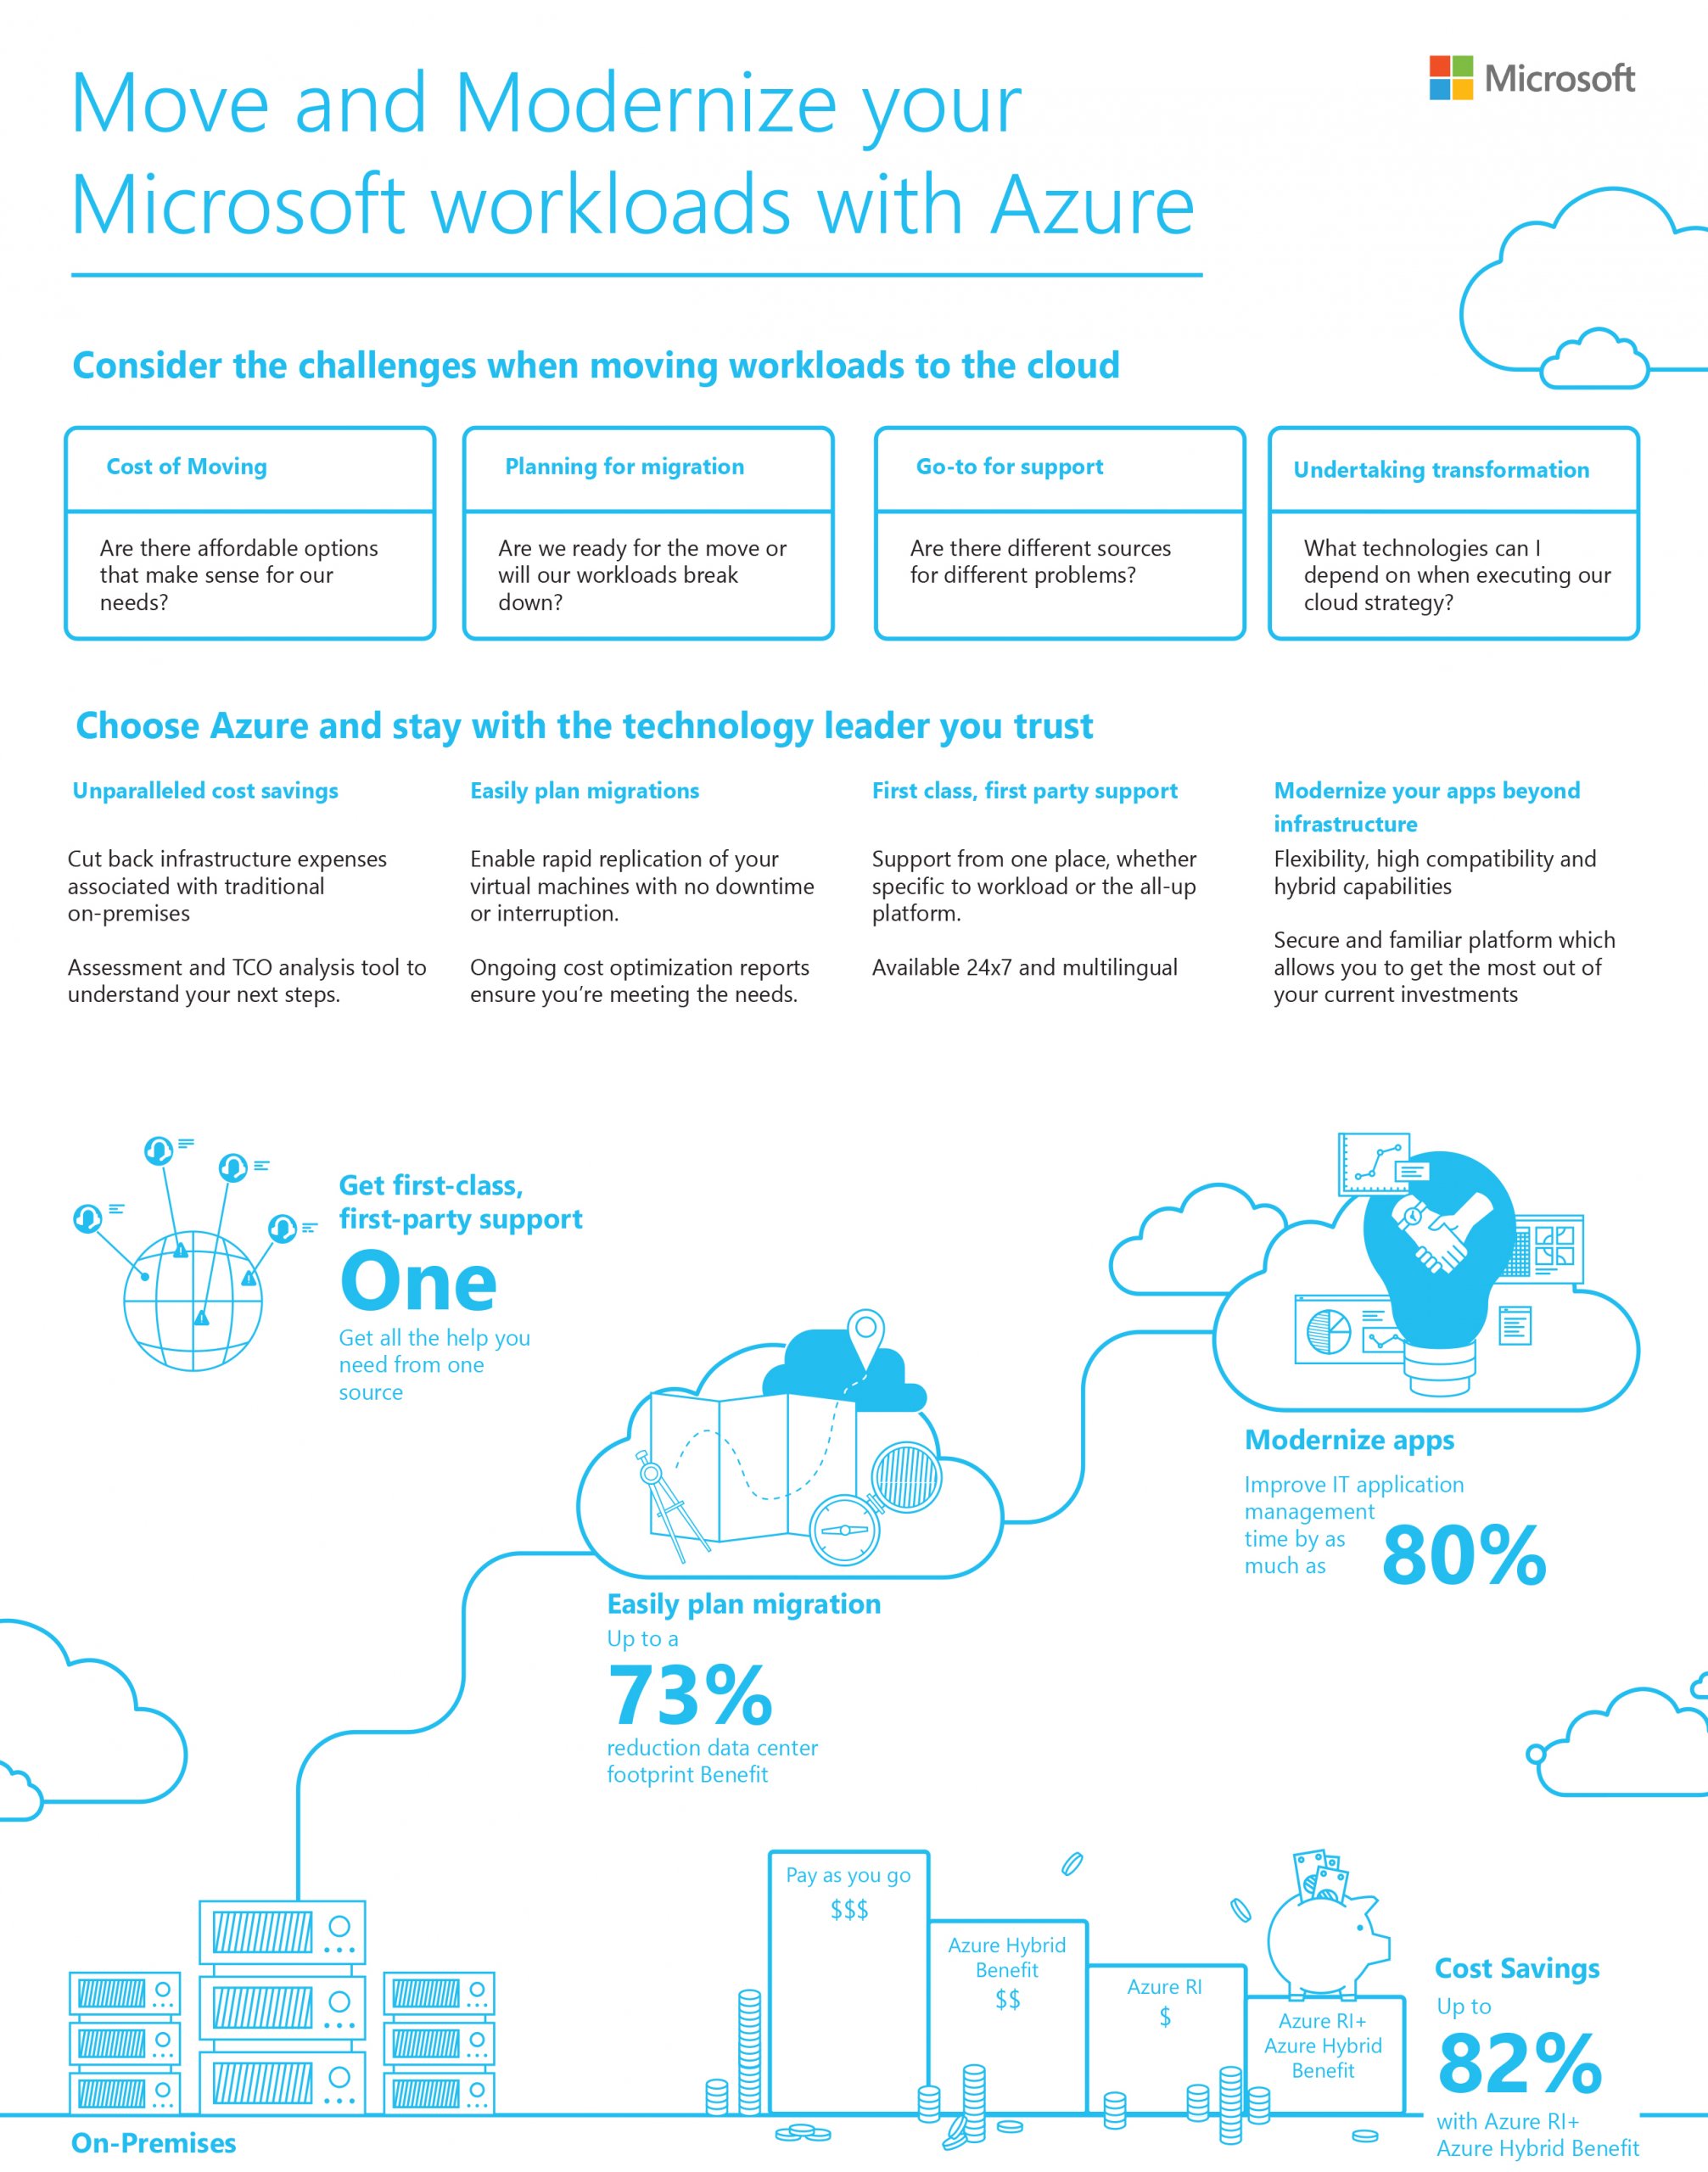
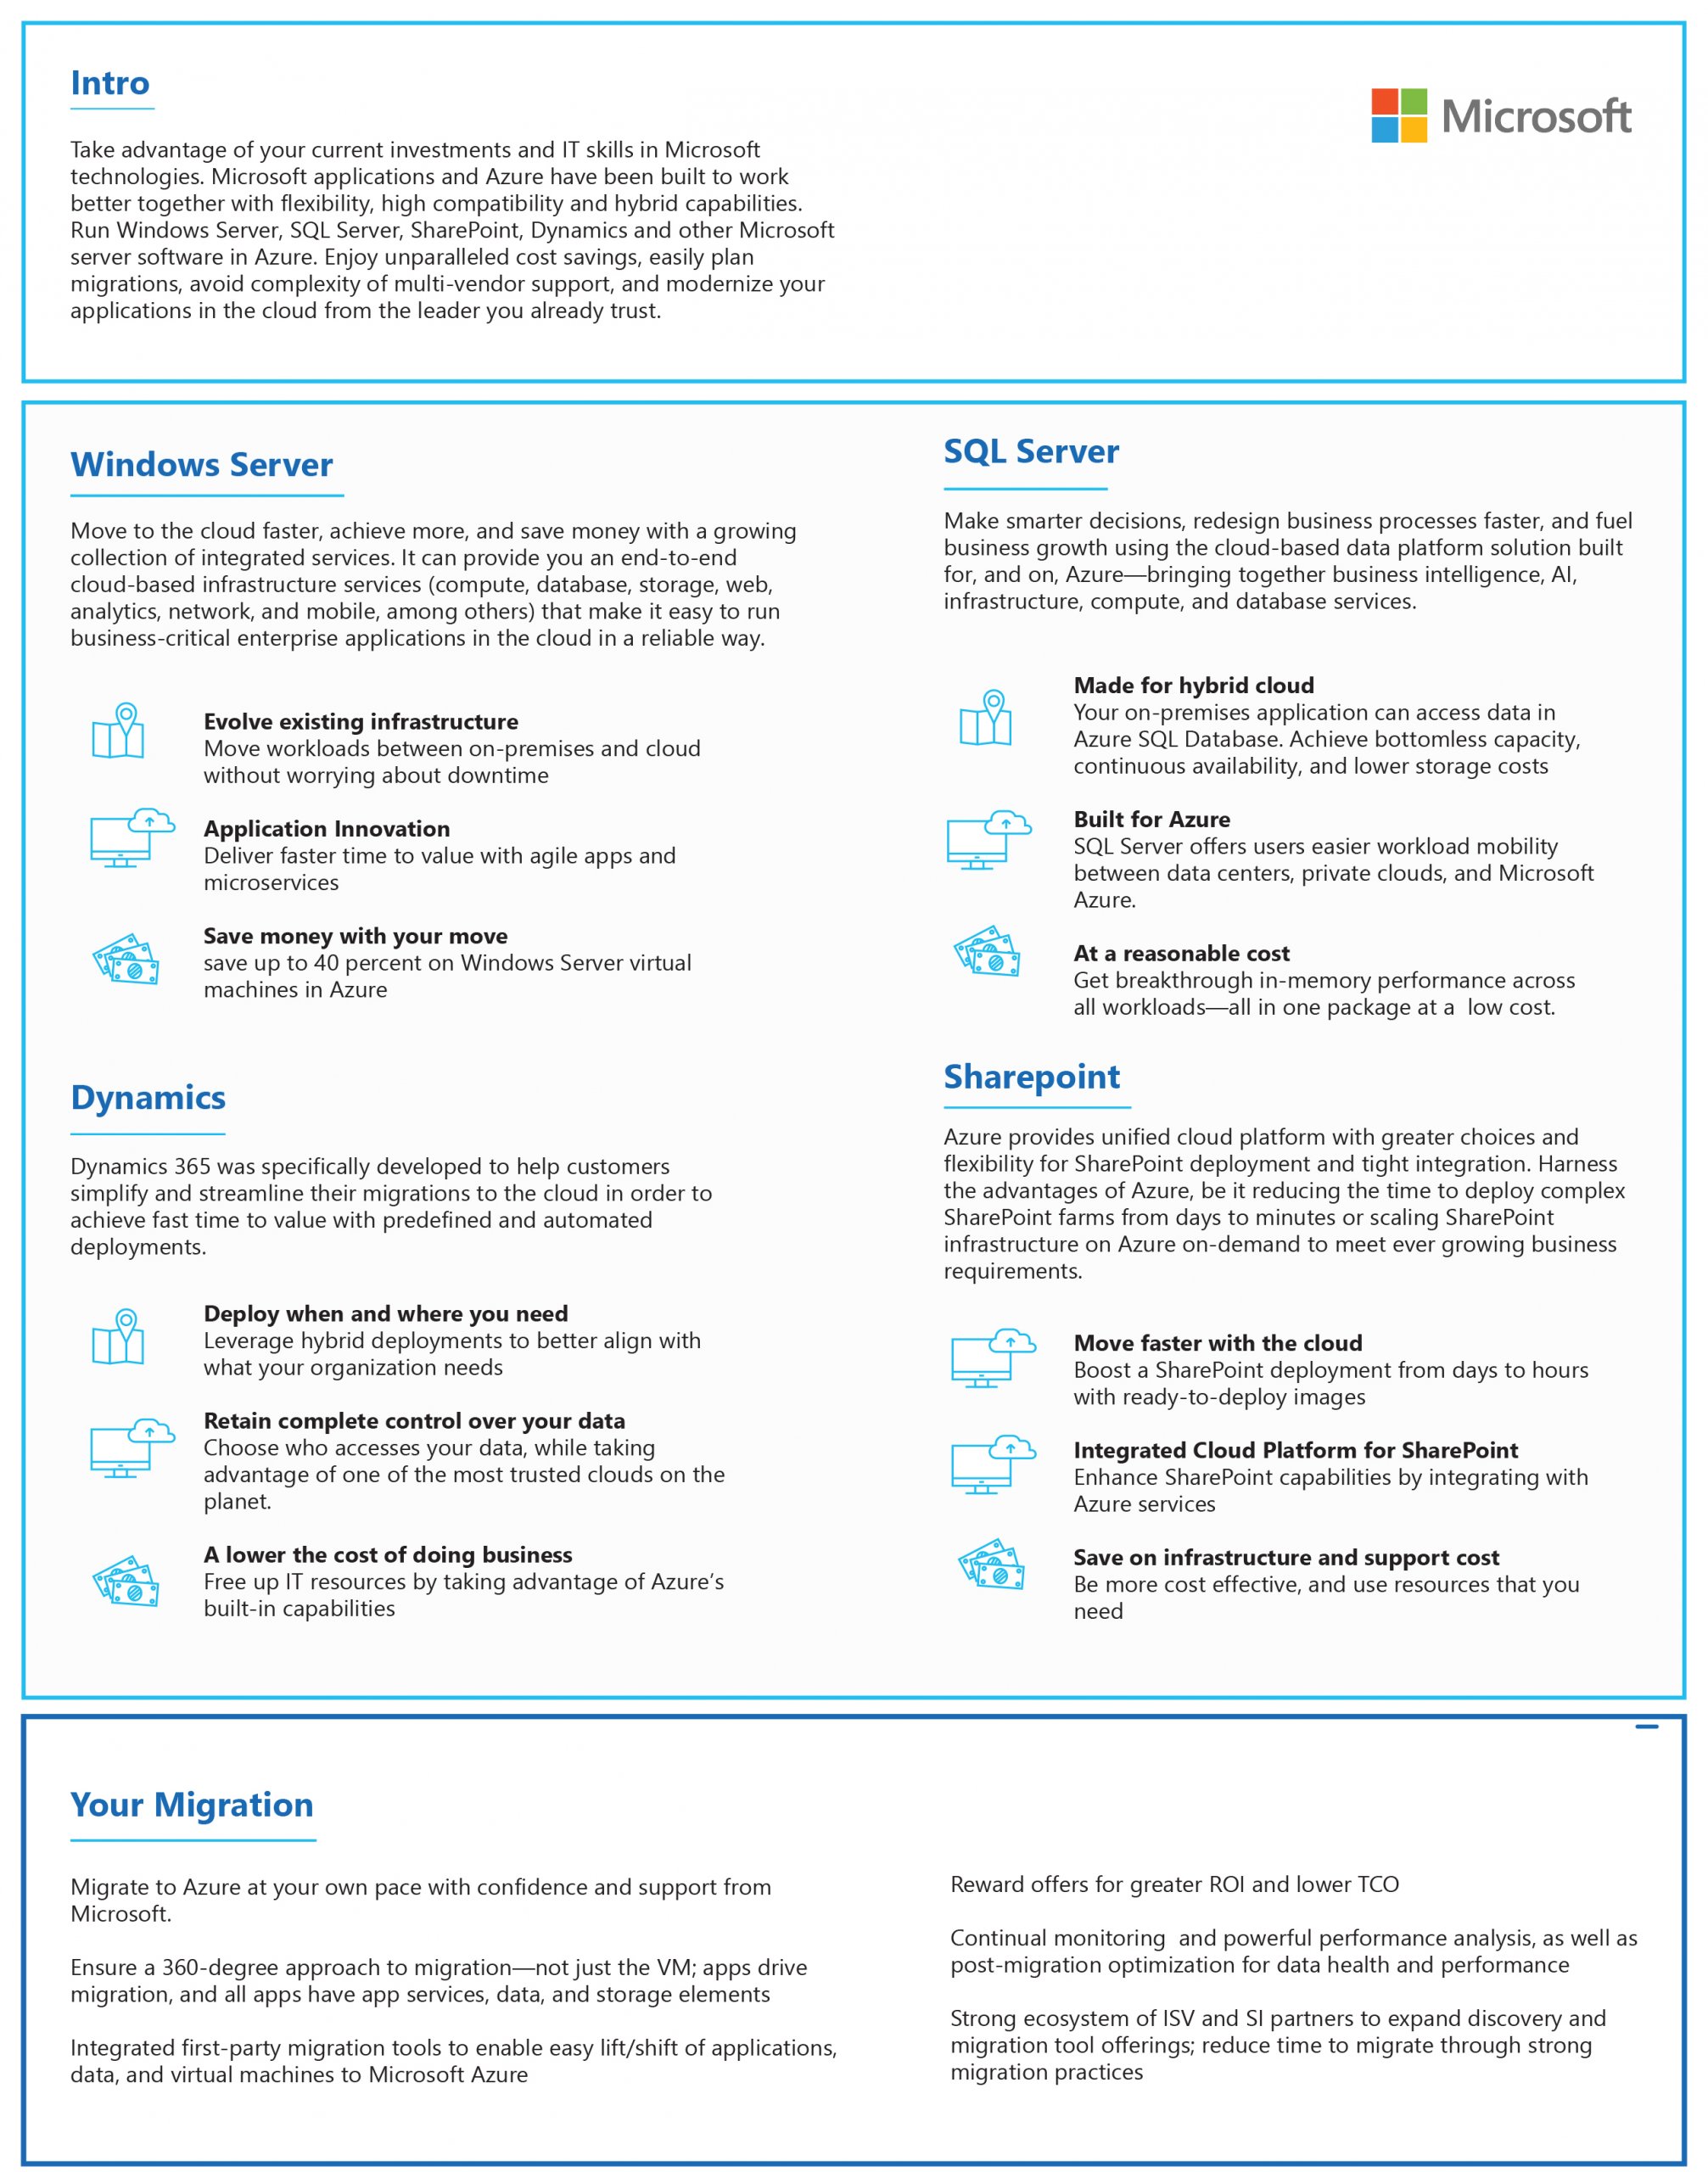
Did you know migrating to Microsoft Azure can reduce your data center footprint 73%? 

Take advantage of your current investments and IT skills in Microsoft technologies. Microsoft applications and Azure have been built to work better together with flexibility, high compatibility and hybrid capabilities. 

Check out this infographic to learn, how you can get unparalleled cost savings, easily plan migrations, avoid complexity of multi-vendor support, and modernize your applications in the cloud from the leader you already trust.

Migrate to Azure at your own pace with confidence and support from CloudIQ. At CloudIQ Technologies, we have knowledgeable and professional team ready to help you modernize workloads with Azure. Contact us today to learn more.

test beta

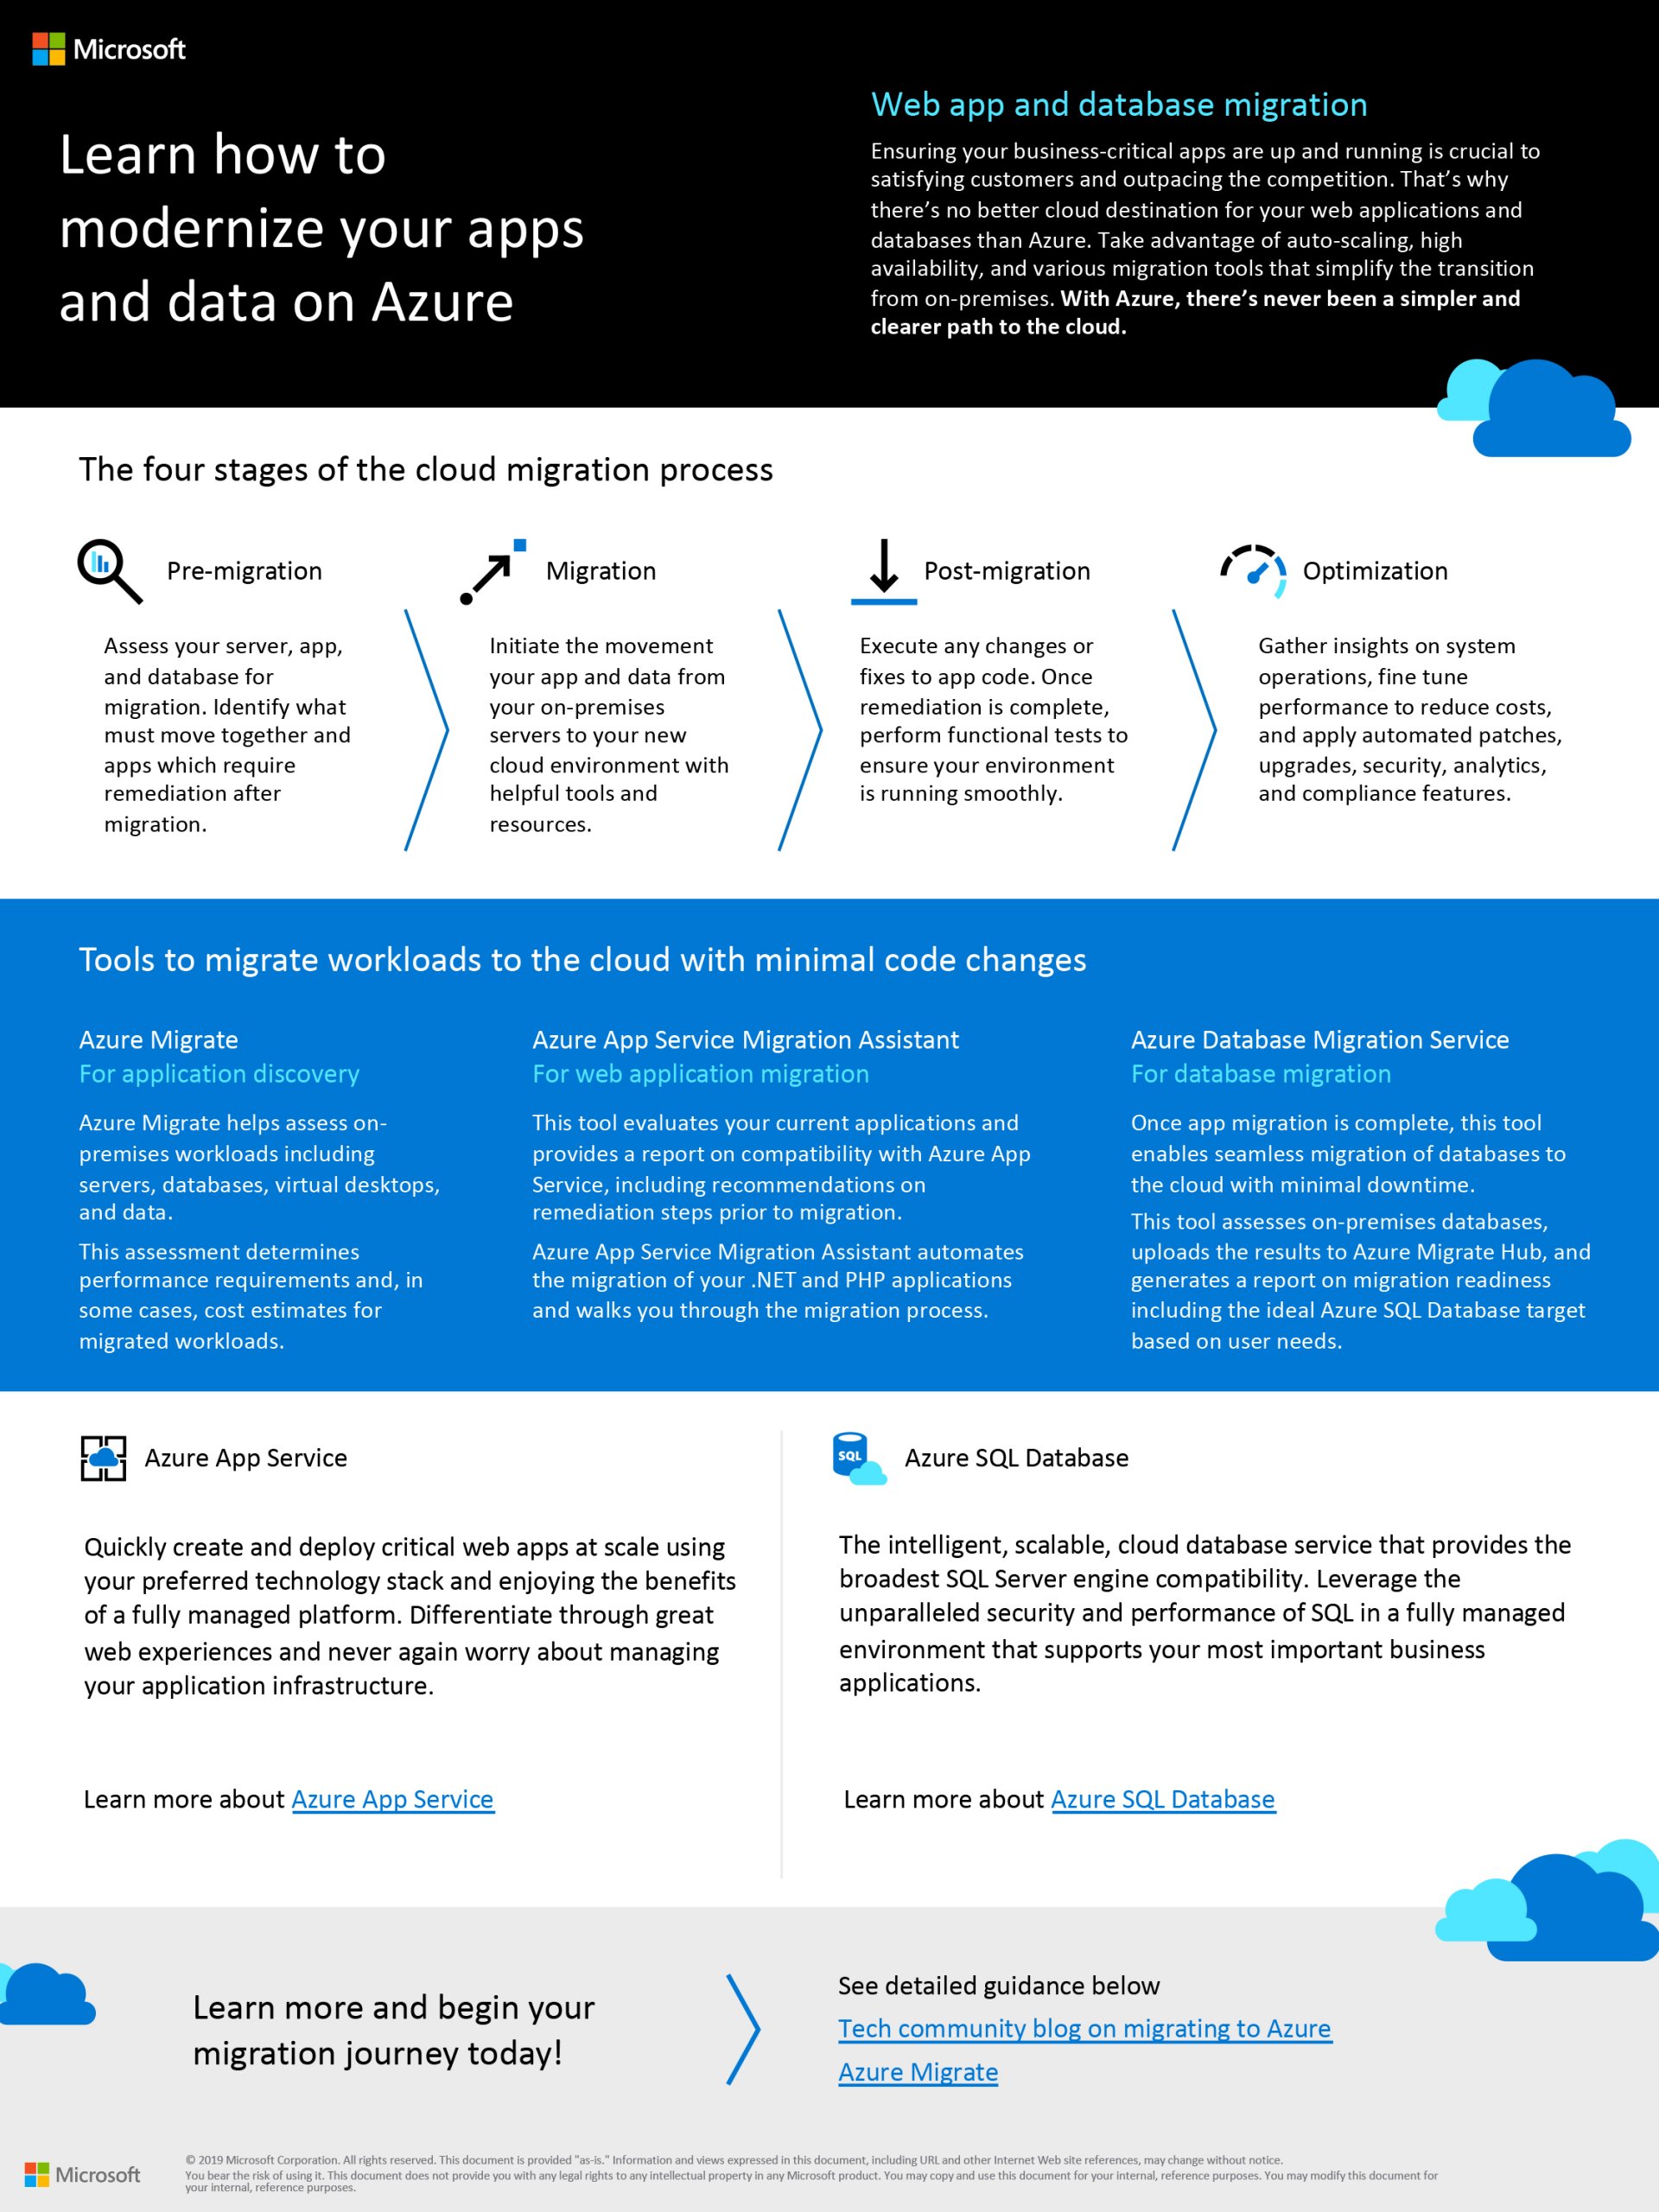
Break down the cloud journey with four stages of the process—starting with a pre-migration assessment and then looking at migration, post-migration, and optimization. Microsoft Azure has you covered with tools created specifically for you.

Would you like to modernize your apps and data on Azure? At CloudIQ Technologies, we have knowledgeable and professional team ready to help you. Contact us today to learn more.

In our previous blog on getting started with Azure Databricks, we looked at Databricks tables.  In this blog, we will look at a type of Databricks table called Delta table and best practices around storing data in Delta tables.

1. Delta Lake

Delta Lake is an open-source storage layer that brings reliability to data lakes. Delta Lake provides ACID transactions, scalable metadata handling, and unifies streaming and batch data processing. Delta Lake runs on top of your existing data lake and is fully compatible with Apache Spark APIs. Databricks Delta table is a table that has a Delta Lake as the data source similar to how we had a CSV file as a data source for the table in the previous blog.

2. Table which is not partitioned

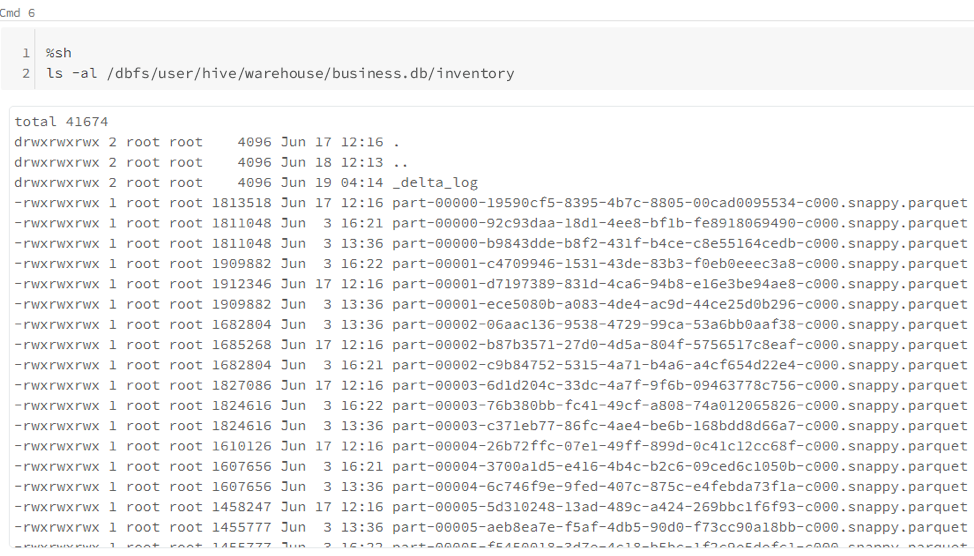
When we create a delta table and insert records into it, Databricks loads the data into multiple small files.  You can see the multiple files created for the table “business.inventory” below

3. Partitioned table

Partitioning involves putting different rows into different tables.  E.g., if we have an address table with addresses in the US, the addresses might be stored in 50 different tables corresponding to the 50 states in the US.  A view with a union might be created over all of them to provide a complete view of all addresses.

Sample code to create a table partitioned by date column is given below:

CREATE TABLE events (
  date DATE,
  eventId STRING,
  eventType STRING,
  data STRING)
USING delta
PARTITIONED BY (date) 

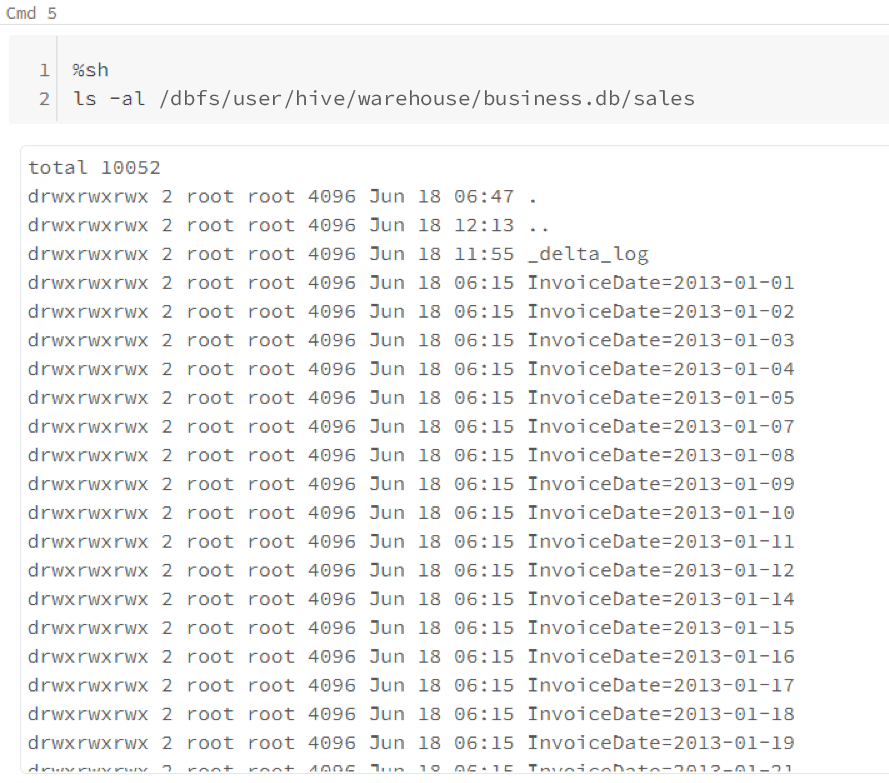
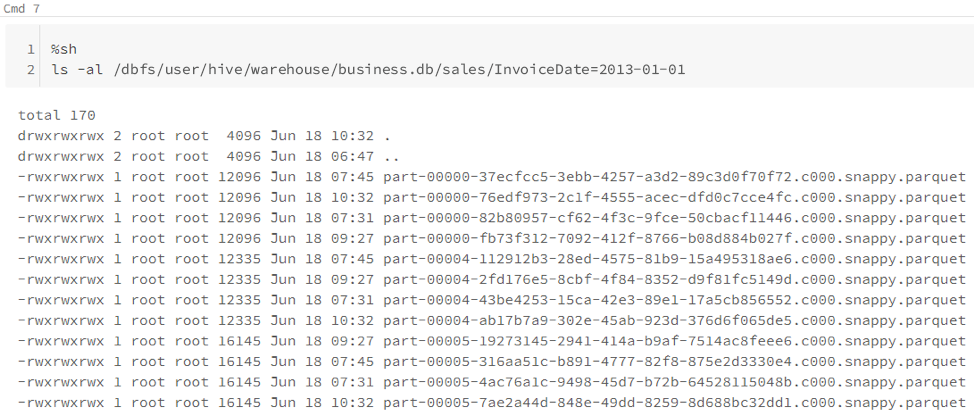
The table “business.sales” given below is partitioned by InvoiceDate.  You can see that there is a folder created for each InvoiceDate and within the folders, there are multiple files that store the data for this table.

This partitioning will be useful when we have queries selecting records from this table with InvoiveDate in WHERE clause. 

E.g.:
SELECT SLSDA_ID, RcdType, DistId
FROM business.sales
WHERE InvoiceDate = ‘2013-01-01’

In total there are 40,545 files for this table which you can see from below screenshot

4. OPTIMIZE

SMALL FILE PROBLEM

Historical and new data is often written in very small files and directories.  This data may be spread across a data center or even across the world (that is, not co-located).  The result is that a query on this data may be very slow due to

  • network latency
  • volume of file metadata

The solution is to compact many small files into one larger file.

OPTIMIZE command invokes the bin-packing (Compaction) algorithm to coalesce small files into larger ones.  Small files are compacted together into new larger files up to 1GB.

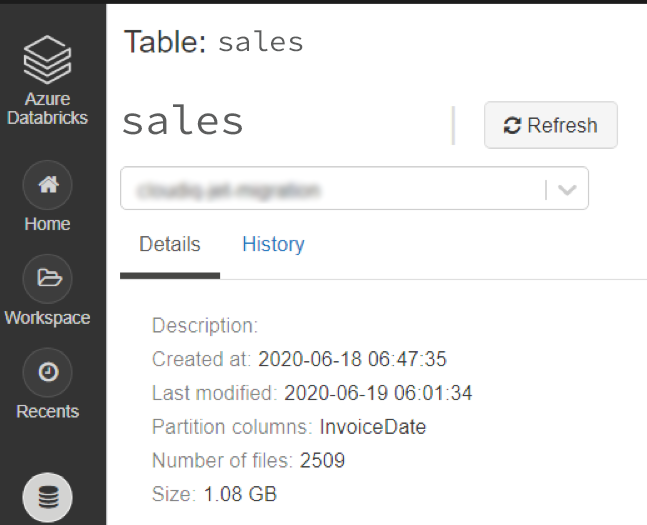
You can see below that the OPTIMIZE command has removed the 40,545 files and instead of them added 2378 files.  Also, observe that after Optimization the size of the table has decreased from 1.49 GB to 1.08 GB

5. Optimize table which is not partitioned

Optimize will compact the small files for tables that are not partitioned too.

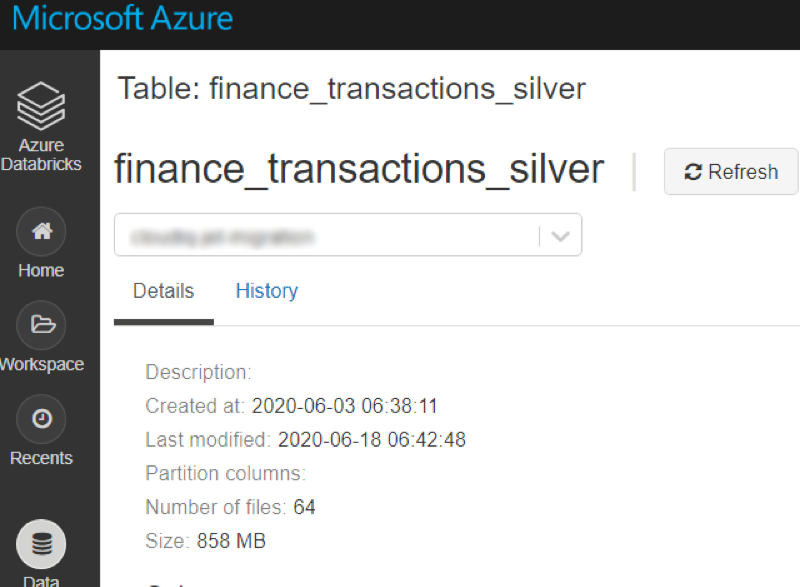
business.finance_transactions_silver table is not partitioned and is currently having 64 files with total size 858 MB

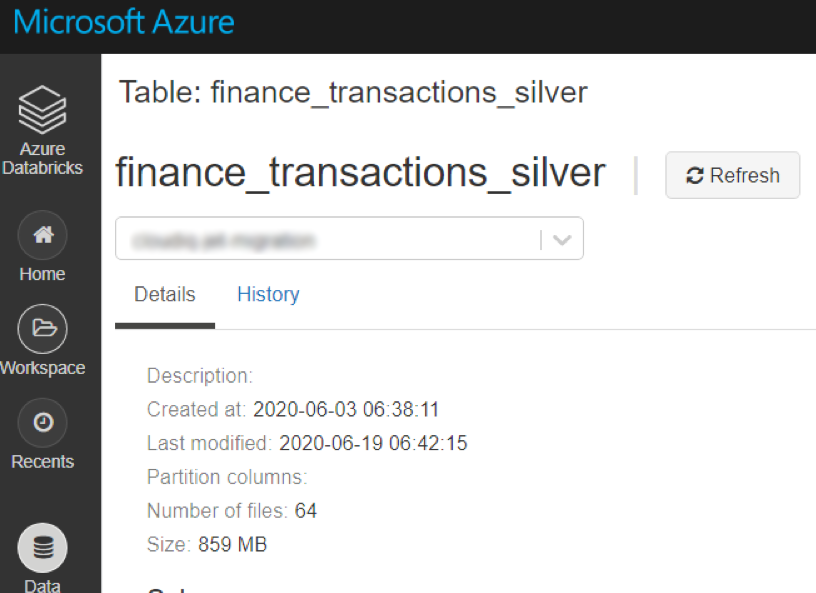
Running the Optimize command coalesces the 64 files to 1 file

Note that “partitionsOptimized” is 1 in this case.  Previously for the partitioned table “partitionsOptimized was 2509.  OPTIMIZE command coalesces the small files within a partition only.  If the table is not partitioned, the whole table is considered as a single xpartition.

6. ZORDER
  • Data Skipping is a performance optimization that aims at speeding up queries that contain filters (WHERE clauses).
    As new data is inserted into a Databricks Delta table, file-level min/max statistics are collected for all columns (including nested ones) of supported types. Then, when there’s a lookup query against the table, Databricks Delta first consults these statistics to determine which files can safely be skipped.  This is done automatically and no specific commands are required to be run for this.
  • Z-Ordering is a technique to co-locate related information in the same set of files.
    Z-Ordering maps multidimensional data to one dimension while preserving the locality of the data points.

Given a column that you want to perform ZORDER on, say OrderColumn, Delta

  • Takes existing parquet files within a partition.
  • Maps the rows within the parquet files according to OrderColumn using the Z-order curve algorithm.
  • In the case of only one column, the mapping above becomes a linear sort
  • Rewrites the sorted data into new parquet files.

Note: We cannot use the table partition column also as a ZORDER column.

Syntax for ZORDER is

OPTIMIZE tablename
ZORDER BY (OrderColumn) 
7. Best practices

a. PARTITION BY

  • Partition the table by a column which is used in the WHERE clause or ON clause (join).  The most commonly used partition column is the date.
  • Use columns with low cardinality.  If the cardinality of a column will be very high, do not use that column for partitioning. For example, if you partition by a column userId and if there can be 1M distinct user IDs, then that is a bad partitioning strategy.
  • Amount of data in each partition: You can partition by a column if you expect data in that partition to be at least 1 GB.  Partitioning is not required for smaller tables.
  • PARTITION BY is done on a single column only

b. OPTIMIZE

  • OPTIMIZE is required for all tables to which we write data continuously on a daily basis.
  • OPTIMIZE is not required for tables that have static data/reference data which are rarely updated.
  • There is a cost associated with OPTIMIZE (Running Optimize command for sales took 6.64 minutes).  We should run it more often (daily) if we want better end-user query performance.  We should run it less often if we want to optimize costs.

c. ZORDER BY

  • If we expect a column to be commonly used in query predicates and if that column has high cardinality (that is, a large number of distinct values), then use ZORDER BY.
  • We can specify multiple columns for ZORDER BY as a comma-separated list. However, the effectiveness of the locality drops with each additional column.
8. References:

Backing up on-premises resources to the cloud leverages the power and scale of the cloud to deliver high-availability with no maintenance or monitoring overhead. With Azure Backup service the benefits keep adding up, right from data security to centralized monitoring and management.

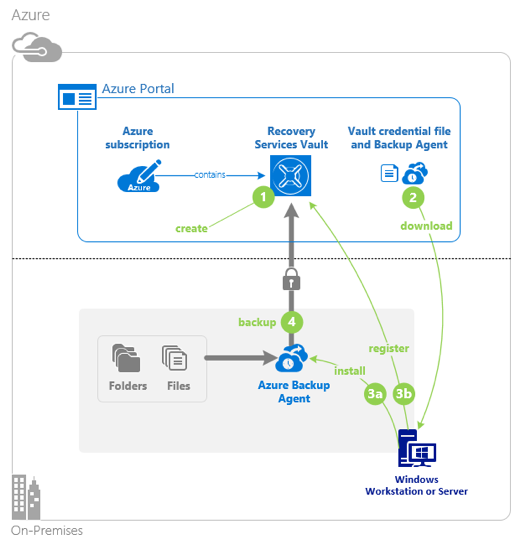
Azure Backup service uses the MARS agent to back up files, folders, and system state from on-premises machines and Azure VMs. The backups are stored in a Recovery Services vault.

In this article, we will look at how to back up on-premise files and folders using Microsoft Azure Recovery Services (MARS) agent.

There are two ways to run the MARS agent:

  • Directly on on-premises Windows machines.
  • On Azure VMs that run Windows side by side with the Azure VM backup extension.

Here is the step by step process.

Create a Recovery Services vault

1. Sign in to the Azure portal.
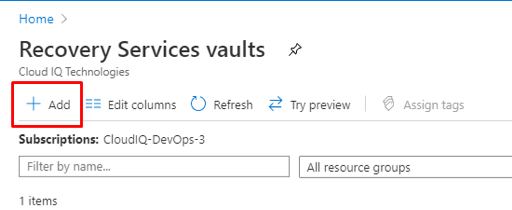
2. On the Recovery Services vaults dashboard, select “Add”.

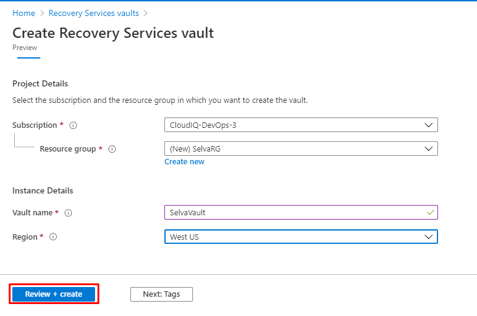
3. The Recovery Services vault dialog box opens. Provide values of the Name, Subscription, Resource group, and Location.
4. Select “Create”.

Download the MARS agent

1. Download the MARS agent so that you can install it on the machines that you want to back up.
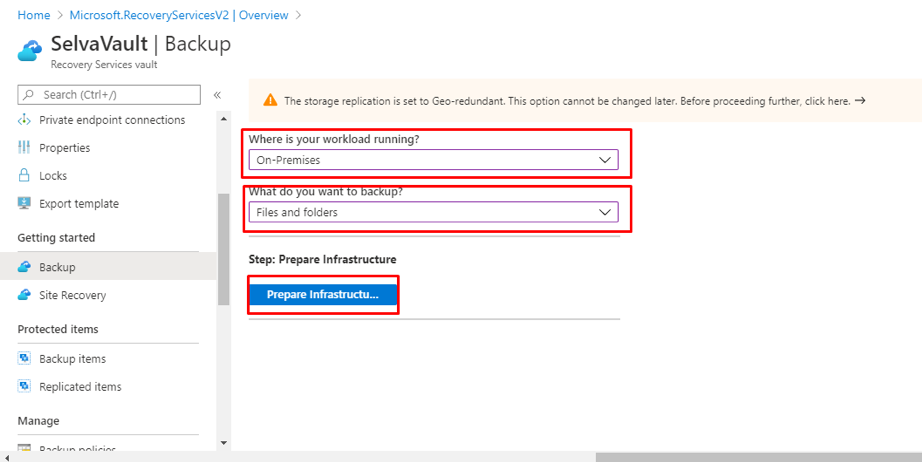
2. In the vault, select “Backup”.
3. Select On-premises for “Where is your workload running?”
4. Select Files and folders for “What do you want to back up?”
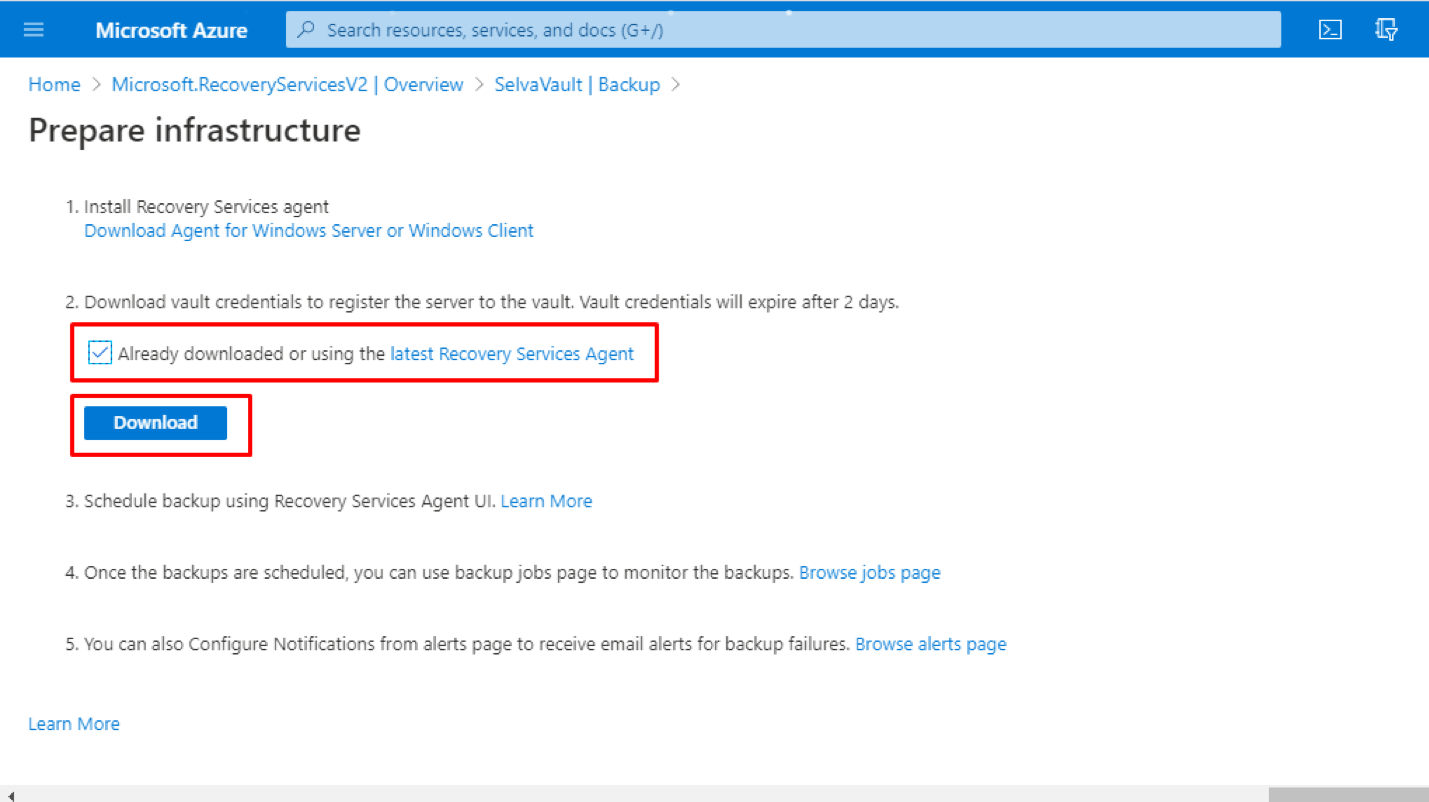
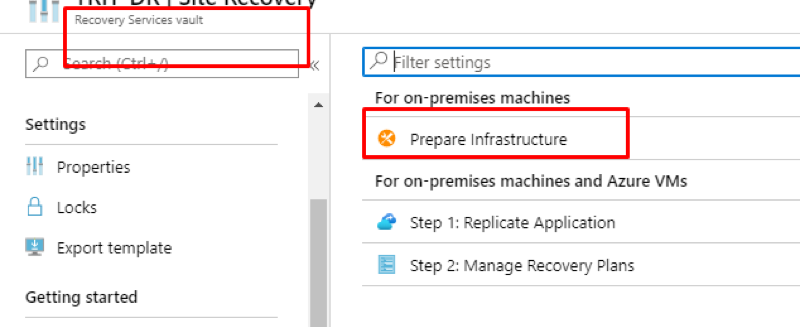
5. Select “Prepare Infrastructure”.

5. For “Prepare infrastructure”, under Install Recovery Services agent, download the MARS agent.
6. Select “Already downloaded or using the latest Recovery Services Agent”, and then download the vault credentials.
7. Select “Save”.

Install and register the agent

1. Run the MARSagentinstaller.exe file on the VM.
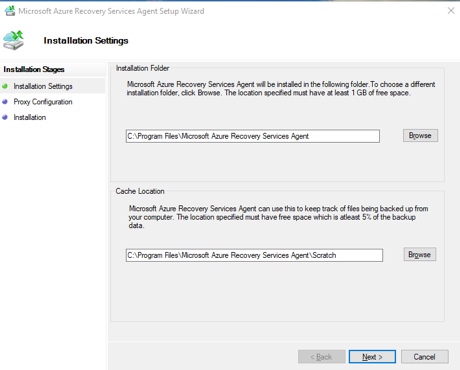
2. In the “MARS Agent Setup Wizard”, select “Installation Settings”.
3. Choose where to install the agent and choose a location for the cache. Select “Next”.

  • The cache is for storing data snapshots before sending them to recovery services vault.
  • The cache location should have free space equal to at least 5 percent of the size of the data you’ll back up.

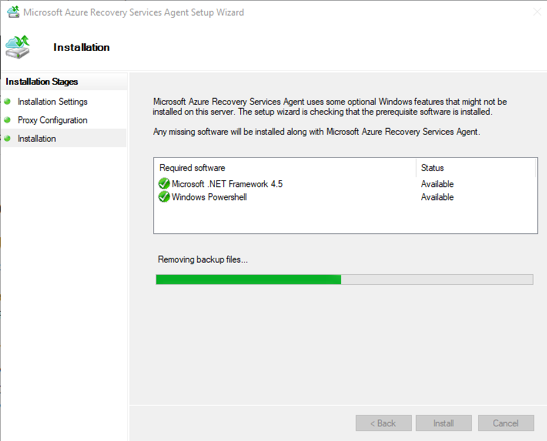
4. For Proxy Configuration, specify how the agent that runs on the Windows machine will connect to the internet. Then select “Next”.

5. For Installation, review, and select “Install”.
6. After the agent is installed, select “Proceed to Registration”.

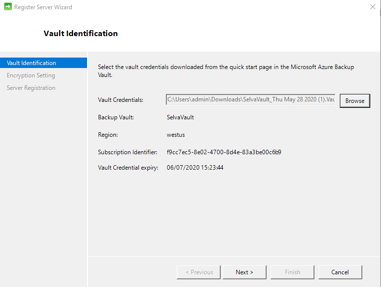
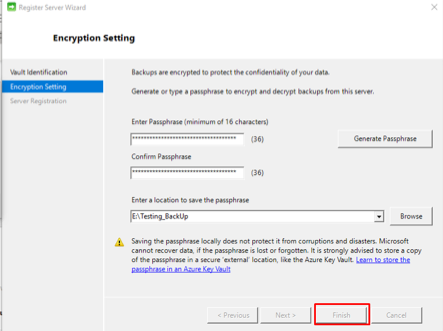
7. In Register Server Wizard > Vault Identification, browse to and select the credentials file. Then select “Next”.

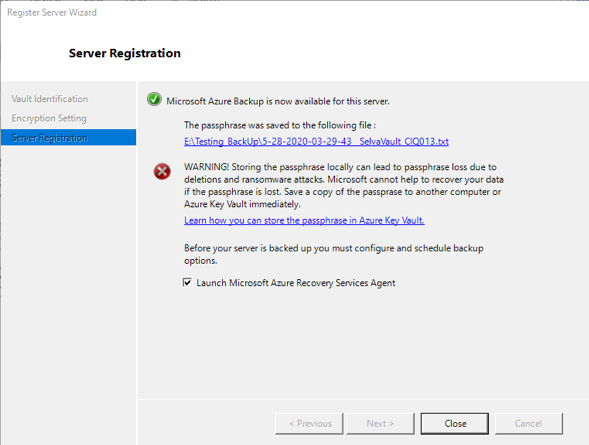
8. On the “Encryption Setting” page, specify a passphrase(user-defined) which is used to encrypt and decrypt backups for the machine.

9. Save the passphrase in a secure location. It is needed while restoring a backup.
10. Select “Finish”.

Create a backup policy

Steps to create a backup policy:

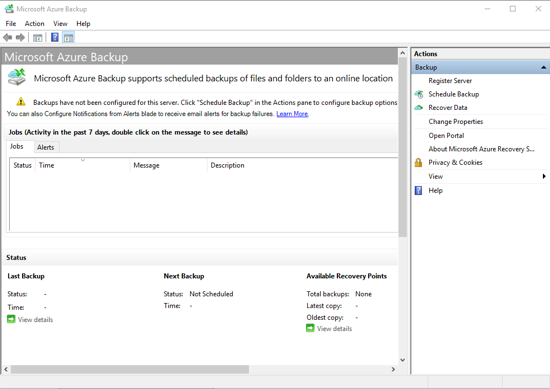
1. Open the MARS agent console.
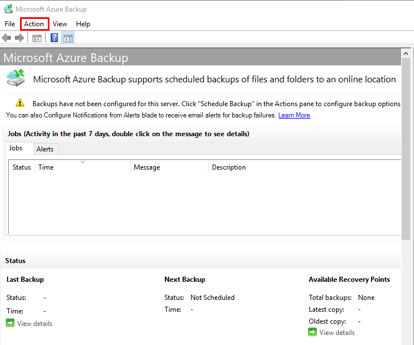
2. Under “Actions”, select “Schedule Backup”.

3. In the “Schedule Backup Wizard”, select “Getting started” and click “Next”.
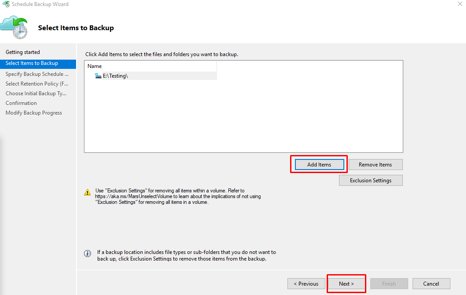
4. Under “Select Items to Back up”, select “Add Items”.

5. Select items to back up, and select OK.

6. On the “Select Items to Back Up” page, select “Next”.
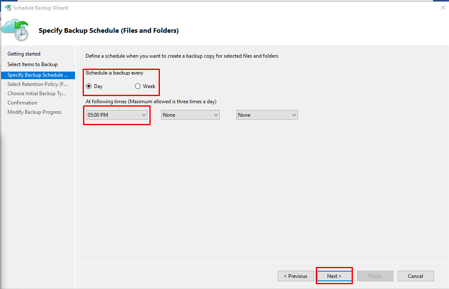
7. Specify when to take daily or weekly backups in the “Specify Backup Schedule” page and select “Next”.
8. It is possible to schedule up to three daily backups per day and can run weekly backups too.

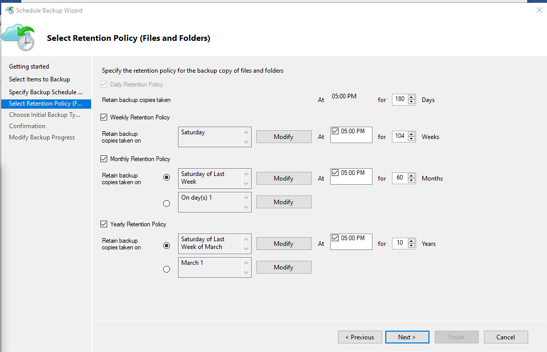
9. On the “Select Retention Policy” page, specify how to store copies of your data. And select “Next”.
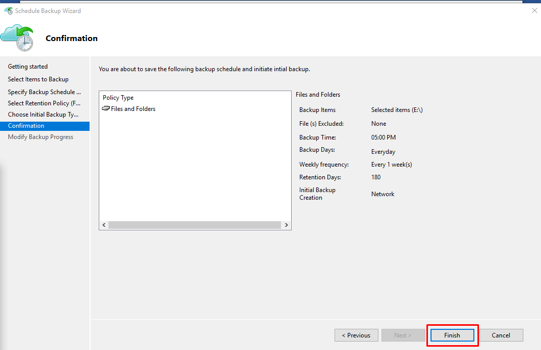
10. On the Confirmation page, review the information, and then select “Finish”.

11. After the wizard finishes creating the backup schedule, select “Close”.

We hope this step by step guide helps you back up on-premise files and folders using Microsoft Azure Recovery Services (MARS) agent.

Many businesses are struggling to find the talent and capacity to create and manage their machine learning models to actually unlock the insights within their data. Here is an infographic that shows how Microsoft Azure Machine Learning streamlines this process to make modeling accessible to all businesses. 

What’s holding your business back from using AI to turn your data into actionable insights? Azure Machine Learning makes AI more accessible to businesses of all sizes and experience levels by reducing cost and helping you create and manage your models. But you don’t have to go it alone. We can help you assess your business needs and adopt the right AI solution. Contact us today to learn how we can help transform your business with AI.

The distributed nature of cloud applications requires a messaging infrastructure that connects the components and services, ideally in a loosely coupled manner in order to maximize scalability. In this article let’s explore the asynchronous messaging options in Azure.

At an architectural level, a message is a datagram created by an entity (producer), to distribute information so that other entities (consumers) can be aware and act accordingly. The producer and the consumer can communicate directly or optionally through an intermediary entity (message broker).  

Messages can be classified into two main categories. If the producer expects an action from the consumer, that message is a command. If the message informs the consumer that an action has taken place, then the message is an event.

Commands

The producer sends a command with the intent that the consumer(s) will perform an operation within the scope of a business transaction.

A command is a high-value message and must be delivered at least once. If a command is lost, the entire business transaction might fail. Also, a command shouldn’t be processed more than once. Doing so might cause an erroneous transaction. A customer might get duplicate orders or billed twice.

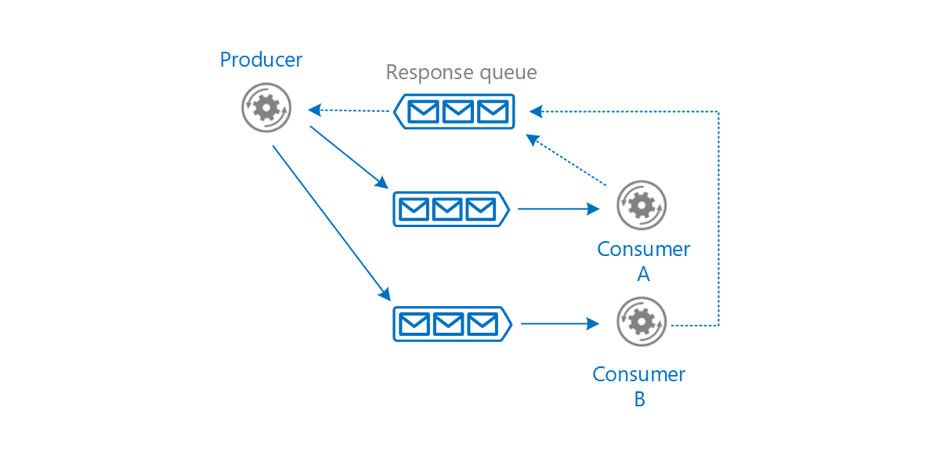
Commands are often used to manage the workflow of a multistep business transaction. Depending on the business logic, the producer may expect the consumer to acknowledge the message and report the results of the operation. Based on that result, the producer may choose an appropriate course of action.

Events

An event is a type of message that a producer raises to announce facts.

The producer (known as the publisher in this context) has no expectations that the events will result in any action.

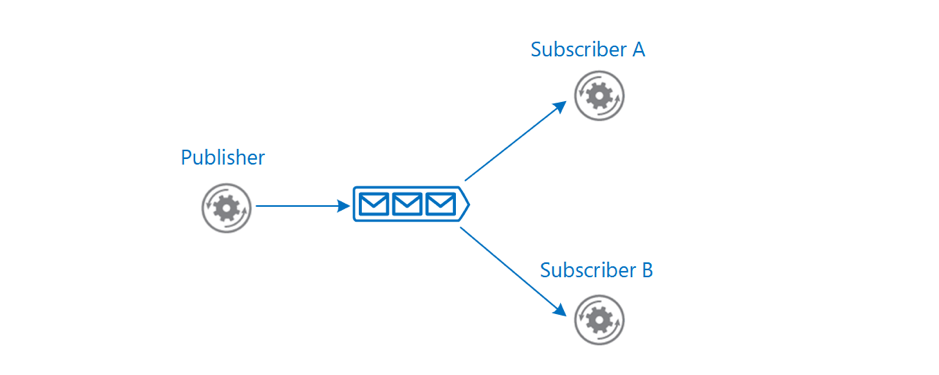
Interested consumer(s), can subscribe, listen for events, and take actions depending on their consumption scenario. Events can have multiple subscribers or no subscribers at all. Two different subscribers can react to an event with different actions and not be aware of one another.

The producer and consumer are loosely coupled and managed independently. The consumer isn’t expected to acknowledge the event back to the producer. A consumer that is no longer interested in the events, can unsubscribe. The consumer is removed from the pipeline without affecting the producer or the overall functionality of the system.

There are two categories of events:

  • The producer raises events to announce discrete facts. A common use case is event notification. For example, Azure Resource Manager raises events when it creates, modifies, or deletes resources. A subscriber of those events could be a Logic App that sends alert emails.
  • The producer raises related events in a sequence, or a stream of events, over a period of time. Typically, a stream is consumed for statistical evaluation. The evaluation can be done within a temporal window or as events arrive. Telemetry is a common use case, for example, health and load monitoring of a system. Another case is event streaming from IoT devices.

A common pattern for implementing event messaging is the Publisher-Subscriber pattern.

Role and benefits of a message broker

An intermediate message broker provides the functionality of moving messages from producer to consumer and can offer additional benefits.

Decoupling

A message broker decouples the producer from the consumer in the logic that generates and uses the messages, respectively. In a complex workflow, the broker can encourage business operations to be decoupled and help coordinate the workflow.

Load balancing

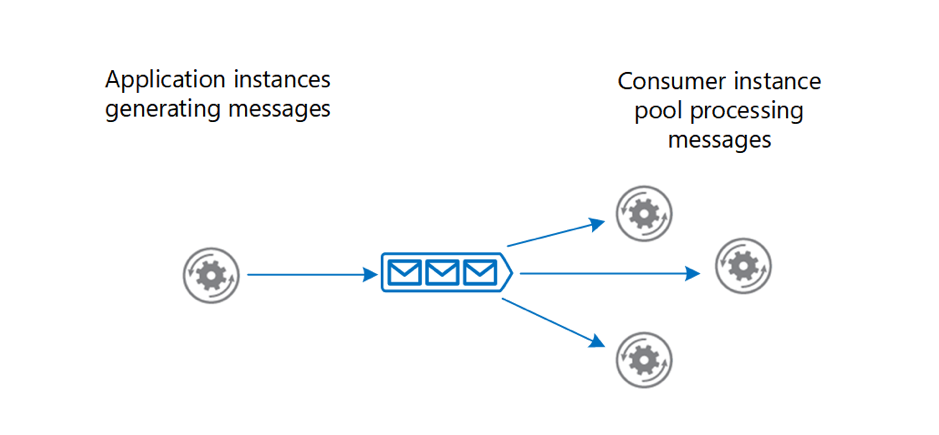
Producers may post a large number of messages that are serviced by many consumers. Use a message broker to distribute processing across servers and improve throughput. Consumers can run on different servers to spread the load. Consumers can be added dynamically to scale out the system when needed or removed otherwise.

Load leveling

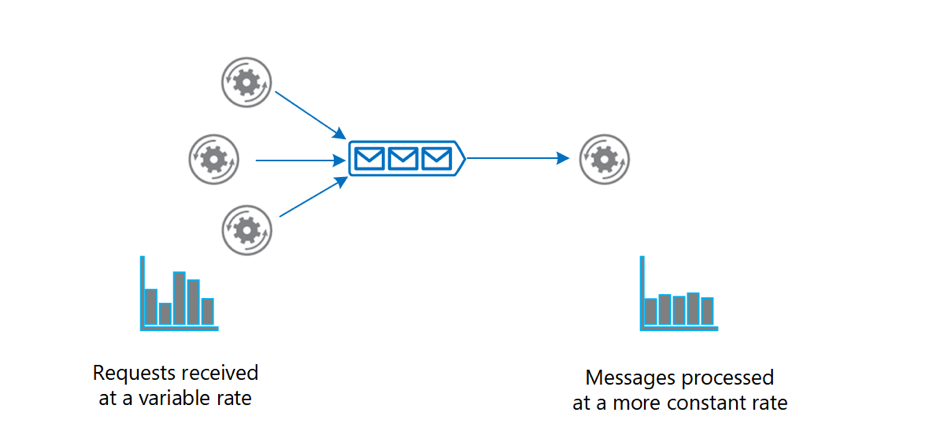
The volume of messages generated by the producer or a group of producers can be variable. At times there might be a large volume causing spikes in messages. Instead of adding consumers to handle this work, a message broker can act as a buffer, and consumers gradually drain messages at their own pace without stressing the system.

Reliable messaging

A message broker helps ensure that messages aren’t lost even if communication fails between the producer and consumer. The producer can post messages to the message broker and the consumer can retrieve them when communication is re-established. The producer isn’t blocked unless it loses connectivity with the message broker.

Resilient messaging

A message broker can add resiliency to the consumers in your system. If a consumer fails while processing a message, another instance of the consumer can process that message. The reprocessing is possible because the message persists in the broker.

Technology choices for a message broker

Azure provides several message broker services, each with a range of features.

Azure Service Bus

Azure Service Bus queues are well suited for transferring commands from producers to consumers. Here are some considerations.

Pull model

A consumer of a Service Bus queue constantly polls Service Bus to check if new messages are available. The client SDKs and Azure Functions trigger for Service Bus abstract that model. When a new message is available, the consumer’s callback is invoked, and the message is sent to the consumer.

Guaranteed delivery

Service Bus allows a consumer to peek the queue and lock a message from other consumers.

It’s the responsibility of the consumer to report the processing status of the message. Only when the consumer marks the message as consumed, Service Bus removes the message from the queue. If a failure, timeout, or crash occurs, Service Bus unlocks the message so that other consumers can retrieve it. This way messages aren’t lost in the transfer.

Message ordering

If you want consumers to get the messages in the order they are sent, Service Bus queues guarantee first-in-first-out (FIFO) ordered delivery by using sessions. A session can have one or more messages.

Message persistence

Service bus queues support temporal decoupling. Even when a consumer isn’t available or unable to process the message, it remains in the queue.

Checkpoint long-running transactions

Business transactions can run for a long time. Each operation in the transaction can have multiple messages. Use checkpointing to coordinate the workflow and provide resiliency in case a transaction fails.

Hybrid solution

Service Bus bridges on-premises systems and cloud solutions. On-premises systems are often difficult to reach because of firewall restrictions. Both the producer and consumer (either can be on-premises or the cloud) can use the Service Bus queue endpoint as the pickup and drop off location for messages.

Topics and subscriptions

Service Bus supports the Publisher-Subscriber pattern through Service Bus topics and subscriptions.

Azure Event Grid

Azure Event Grid is recommended for discrete events. Event Grid follows the Publisher-Subscriber pattern. When event sources trigger events, they are published to Event grid topics. Consumers of those events create Event Grid subscriptions by specifying event types and an event handler that will process the events. If there are no subscribers, the events are discarded. Each event can have multiple subscriptions.

Push Model

Event Grid propagates messages to the subscribers in a push model. Suppose you have an event grid subscription with a webhook. When a new event arrives, Event Grid posts the event to the webhook endpoint.

Custom topics

Create custom Event Grid topics, if you want to send events from your application or an Azure service that isn’t integrated with Event Grid.

High throughput

Event Grid can route 10,000,000 events per second per region. The first 100,000 operations per month are free.

Resilient delivery

Even though successful delivery for events isn’t as crucial as commands, you might still want some guarantee depending on the type of event. Event Grid offers features that you can enable and customize, such as retry policies, expiration time, and dead lettering.

Azure Event Hubs

When working with an event stream, Azure Event Hubs is the recommended message broker. Essentially, it’s a large buffer that’s capable of receiving large volumes of data with low latency. The data received can be read quickly through concurrent operations. You can transform the data received by using any real-time analytics provider. Event Hubs also provides the capability to store events in a storage account.

Fast ingestion

Event Hubs are capable of ingesting millions of events per second. The events are only appended to the stream and are ordered by time.

Pull model

Like Event Grid, Event Hubs also offers Publisher-Subscriber capabilities. A key difference between Event Grid and Event Hubs is in the way event data is made available to the subscribers. Event Grid pushes the ingested data to the subscribers whereas Event Hub makes the data available in a pull model. As events are received, Event Hubs appends them to the stream. A subscriber manages its cursor and can move forward and back in the stream, select a time offset, and replay a sequence at its pace.

Partitioning

A partition is a portion of the event stream. The events are divided by using a partition key. For example, several IoT devices send device data to an event hub. The partition key is the device identifier. As events are ingested, Event Hubs move them to separate partitions. Within each partition, all events are ordered by time.

Event Hubs Capture

The Capture feature allows you to store the event stream to Azure Blob storage or Data Lake Storage. This way of storing events is reliable because even if the storage account isn’t available, Capture keeps your data for a period, and then writes to the storage after it’s available.

We hope this quick start guide helps you get stated on azure messaging and event driven architecture.

Azure Databricks lets you spin up clusters and build quickly in a fully managed Apache Spark environment with the global scale and availability of Azure. And of course, for any production-level solution, monitoring is a critical aspect.

Azure Databricks comes with robust monitoring capabilities for custom application metrics, streaming query events, and application log messages. It allows you to push this monitoring data to different logging services.

In this article, we will look at the setup required to send application logs and metrics from Microsoft Azure Databricks to a Log Analytics workspace.

Prerequisites
  1. Clone the repository mentioned below
    https://github.com/mspnp/spark-monitoring.git
  2. Azure Databricks workspace
  3. Azure Databricks CLI
    Databricks workspace personal access token is required to use the CLI
    You can also use the Databricks CLI from Azure Cloud Shell.
  4. Java IDEs with the following resources
    Java Development Kit (JDK) version 1.8
    Scala language SDK 2.11
    Apache Maven 3.5.4
Building the Azure Databricks monitoring library with Docker

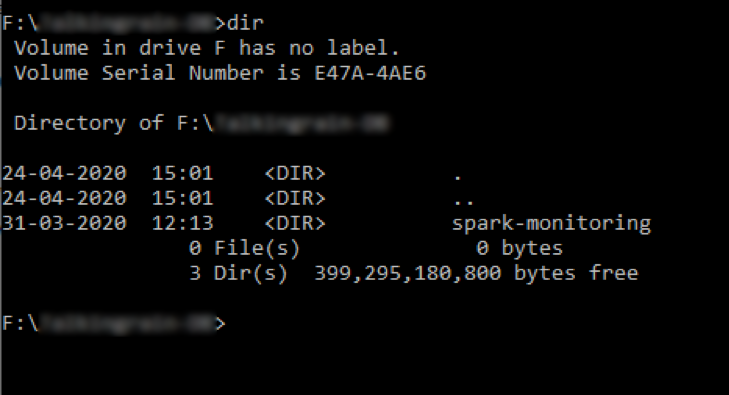
After cloning repository please open the terminal in the respective path

Please run the command as follows
Windows :

docker run -it --rm -v %cd%/spark-monitoring:/spark-monitoring -v "%USERPROFILE%/.m2":/root/.m2 maven:3.6.1-jdk-8 /spark-monitoring/build.sh 

Linux:

chmod +x spark-monitoring/build.sh
docker run -it --rm -v `pwd`/spark-monitoring:/spark-monitoring -v "$HOME/.m2":/root/.m2 maven:3.6.1-jdk-8 /spark-monitoring/build.sh 
Configuring Databricks workspace

dbfs configure –token
It will ask for Databricks workspace URL and Token
Use the personal access token that was generated when setting up the prerequisites
You can get the URL from
Azure portal > Databricks service > Overview

 dbfs mkdirs dbfs:/databricks/spark-monitoring 

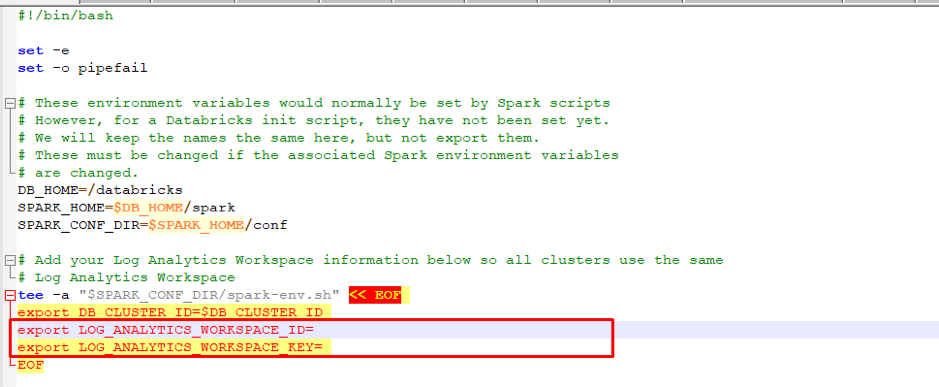
Open the file /src/spark-listeners/scripts/spark-monitoring.sh
Now add the Log Analytics  Workspace ID and Key

Use Databricks CLI to copy the modified script

dbfs cp <local path to spark-monitoring.sh> dbfs:/databricks/spark-monitoring/spark-monitoring.sh 

Use Databricks CLI to copy all JAR files generated

dbfs cp --overwrite --recursive <local path to target folder> dbfs:/databricks/spark-monitoring/ 
Create and configure the Azure Databricks cluster
  1. Navigate to your Azure Databricks workspace in the Azure Portal.
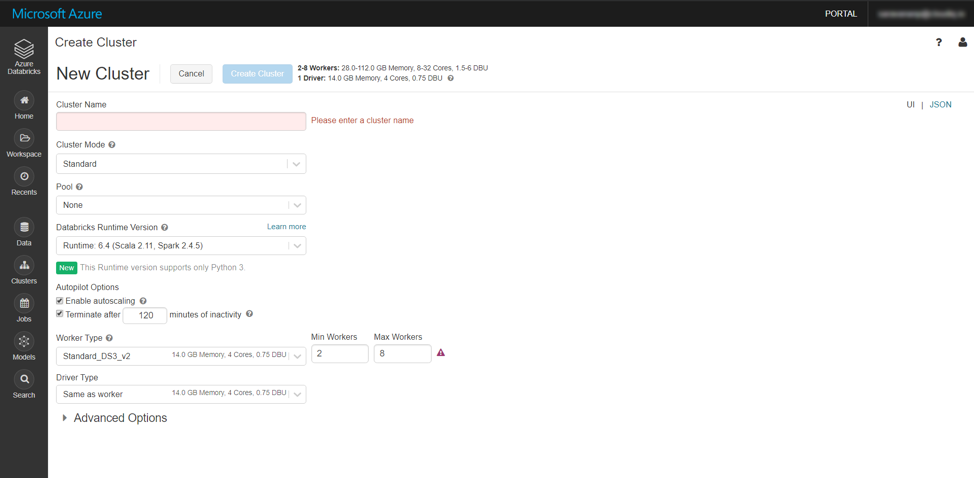
  2. On the home page, click on “new cluster”.
  3. Choose a name for your cluster and enter it in the text box titled “cluster name”.
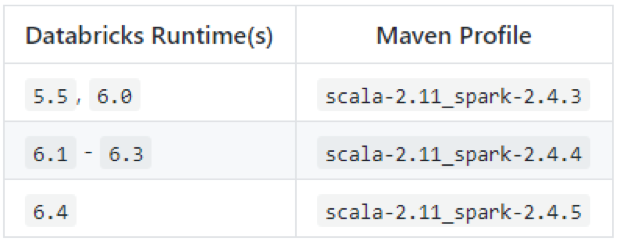
  4. In the “Databricks Runtime Version” dropdown, select 5.0 or later (includes Apache Spark 2.4.0, Scala 2.11).

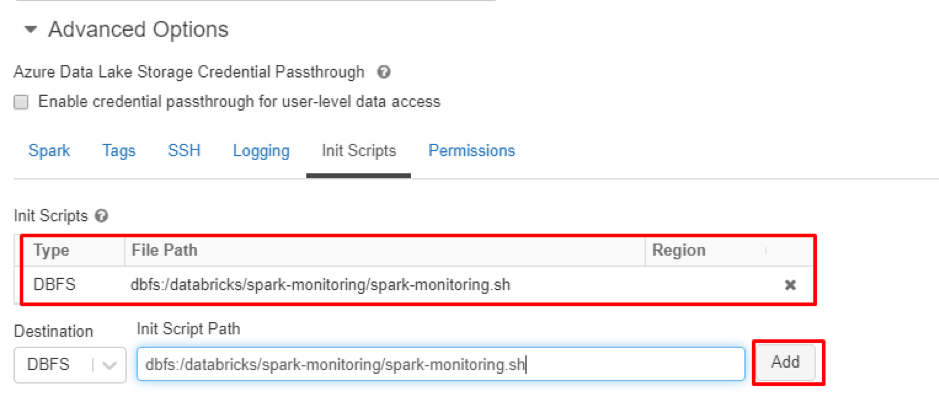
5 Under “Advanced Options”, click on the “Init Scripts” tab. Go to the last line under the
“Init Scripts section” and select “DBFS” under the “destination” dropdown. Enter
“dbfs:/databricks/spark-monitoring/spark-monitoring.sh” in the text box. Click the
“Add” button.

6 Click the “create cluster” button to create the cluster. Next, click on the “start” button to start the cluster.

Now you can run the jobs in the cluster and can get the logs in the Log Analytics workspace

We hope this article helps you set up the right configurations to send application logs and metrics from Azure Databricks to your Log Analytics workspace.

Databricks is a web-based platform for working with Apache Spark, that provides automated cluster management and IPython-style notebooks.  To understand the basics of Apache Spark, refer to our earlier blog on how Apache Spark works

Databricks is currently available on Microsoft Azure and Amazon AWS.  In this blog, we will look at some of the components in Azure Databricks.

1.   Workspace

A Databricks Workspace is an environment for accessing all Databricks assets. The Workspace organizes objects (notebooks, libraries, and experiments) into folders, and provides access to data and computational resources such as clusters and jobs.

Create a Databricks workspace

The first step to using Azure Databricks is to create and deploy a Databricks workspace. You can do this in the Azure portal.

  1. In the Azure portal, select Create a resource > Analytics > Azure Databricks.
  2. Under Azure Databricks Service, provide the values to create a Databricks workspace.

    a. Workspace Name: Provide a name for your workspace.
    b. Subscription: Choose the Azure subscription in which to deploy the workspace.
    c. Resource Group: Choose the Azure resource group to be used.
    d. Location: Select the Azure location near you for deployment.
    e. Pricing Tier: Standard or Premium

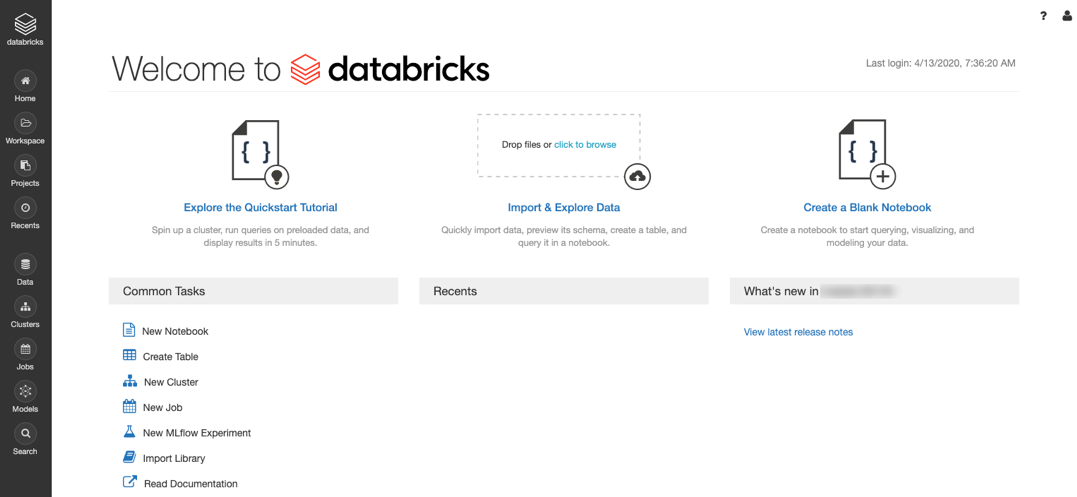
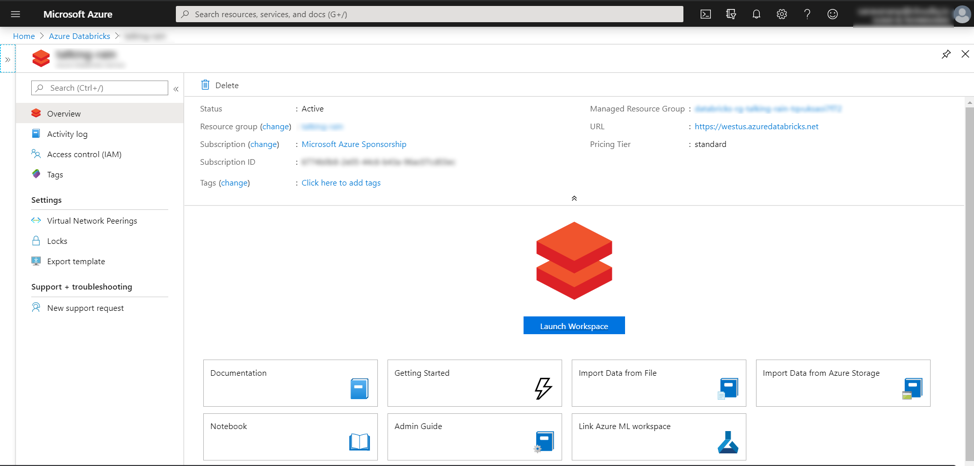
Once the Azure Databricks service is created, you will get the screen given below.  Clicking on the Launch Workspace button will open the workspace in a new tab of the browser.

2.   Cluster

A Databricks cluster is a set of computation resources and configurations on which we can run data engineering, data science, and data analytics workloads, such as production ETL pipelines, streaming analytics, ad-hoc analytics, and machine learning.

To create a new cluster:

  1. Select Clusters from the left-hand menu of Databricks’ workspace.
  2. Select Create Cluster to add a new cluster.

We can select the Scala and Spark versions by selecting the appropriate Databricks Runtime Version while creating the cluster.

3.   Notebooks

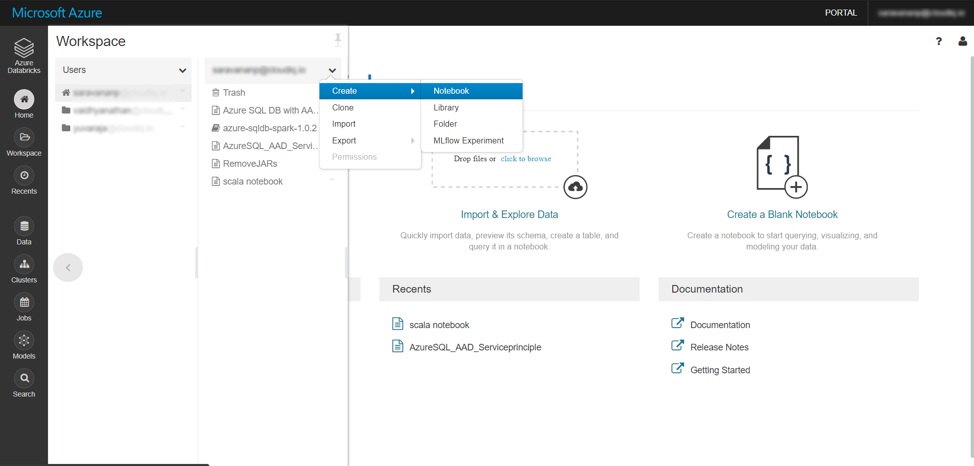
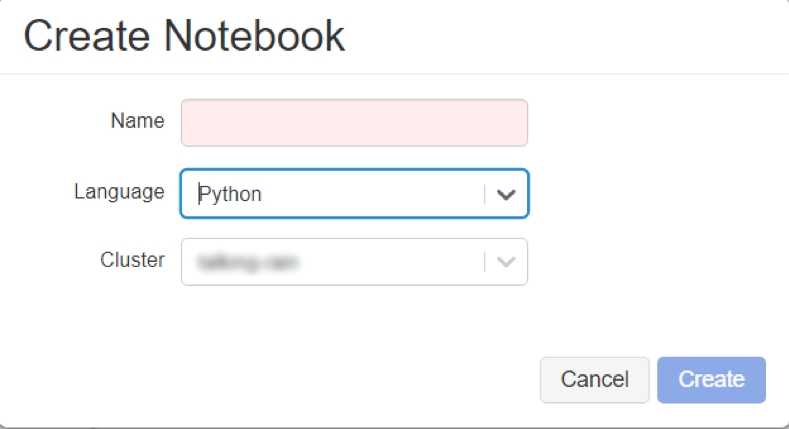
A notebook is a web-based interface to a document that contains runnable code, visualizations, and narrative text.  We can create a new notebook using either the “Create a Blank Notebook” link in the Workspace (or) by selecting a folder in the workspace and then using the Create >> Notebook menu option.

While creating the notebook, we must select a cluster to which the notebook is to be attached and also select a programming language for the notebook – Python, Scala, SQL, and R are the languages supported in Databricks notebooks.

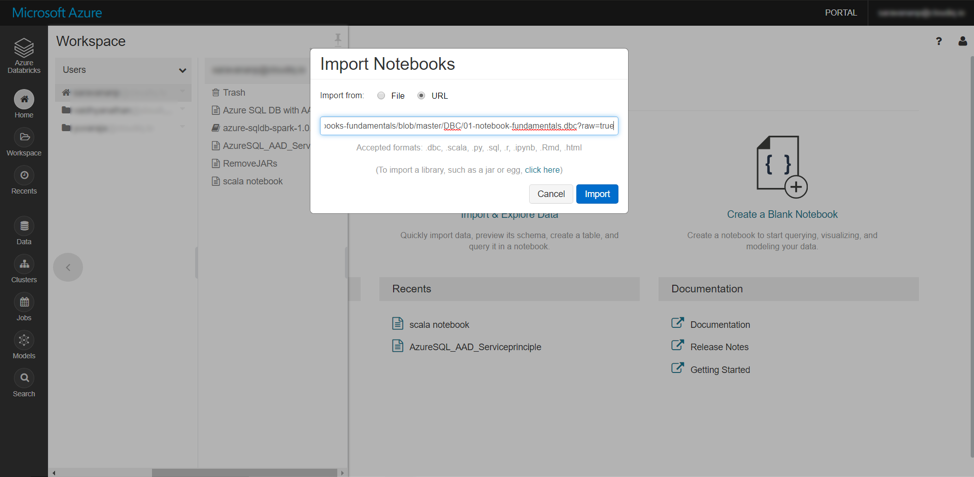
The workspace menu also provides us the option to import a notebook, by uploading a file (or) specifying a file.  This is helpful if we want to import (Python / Scala) code developed in another IDE (or) if we must import code from an online source control system like git.

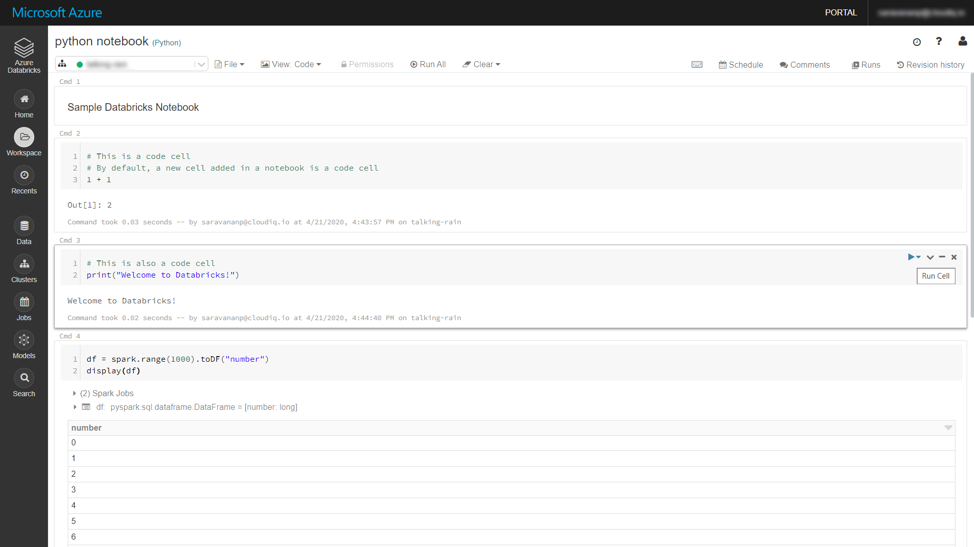
In the below notebook we have python code executed in cells Cmd 2 and Cmd 3; a python spark code executed in Cmd 4.  The first cell (Cmd 1) is a Markdown cell.  It displays text which has been formatted using markdown language.

Magic commands

Even though the above notebook was created with Language as python, each cell can have code in a different language using a magic command at the beginning of the cell.  The markdown cell above has the code below where %md is the magic command:

%md Sample Databricks Notebook 

The following provides the list of supported magic commands:

  • %python – Allows us to execute Python code in the cell.
  • %r – Allows us to execute R code in the cell.
  • %scala – Allows us to execute Scala code in the cell.
  • %sql – Allows us to execute SQL statements in the cell.
  • %sh – Allows us to execute Bash Shell commands and code in the cell.
  • %fs – Allows us to execute Databricks Filesystem commands in the cell.
  • %md – Allows us to render Markdown syntax as formatted content in the cell.
  • %run – Allows us to run another notebook from a cell in the current notebook.

4.   Libraries

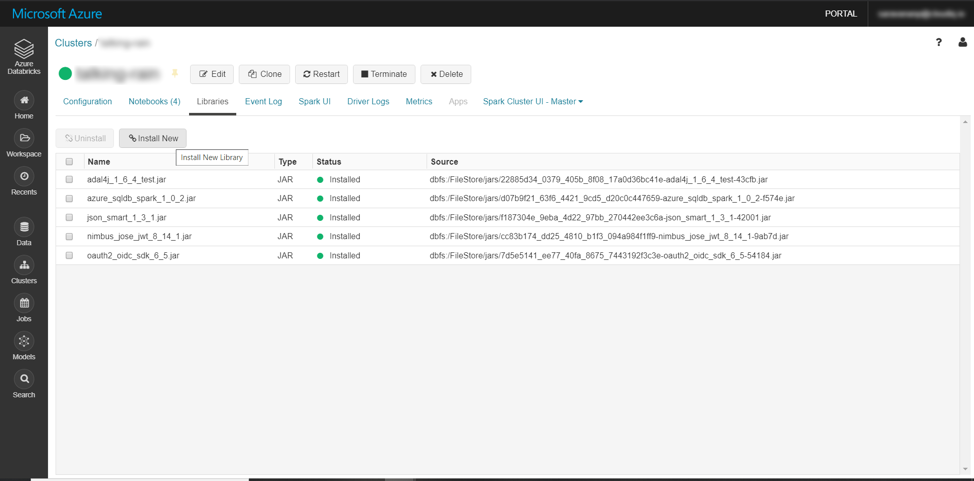
To make third-party or locally built code available (like .jar files) to notebooks and jobs running on our clusters, we can install a library. Libraries can be written in Python, Java, Scala, and R. We can upload Java, Scala, and Python libraries and point to external packages in PyPI, or Maven.

To install a library on a cluster, select the cluster going through the Clusters option in the left-side menu and then go to the Libraries tab.

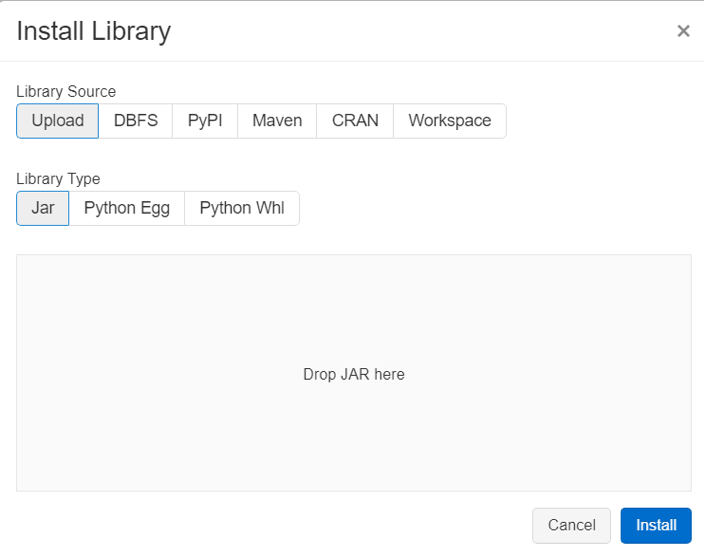
Clicking on the “Install New” option provides us with all the options available for installing a library.  We can install the library either uploading it as a Jar file or getting it from a file in DBFS (Data Bricks File System).  We can also instruct Databricks to pull the library from Maven or PyPI repository by providing the coordinates.

5. Jobs

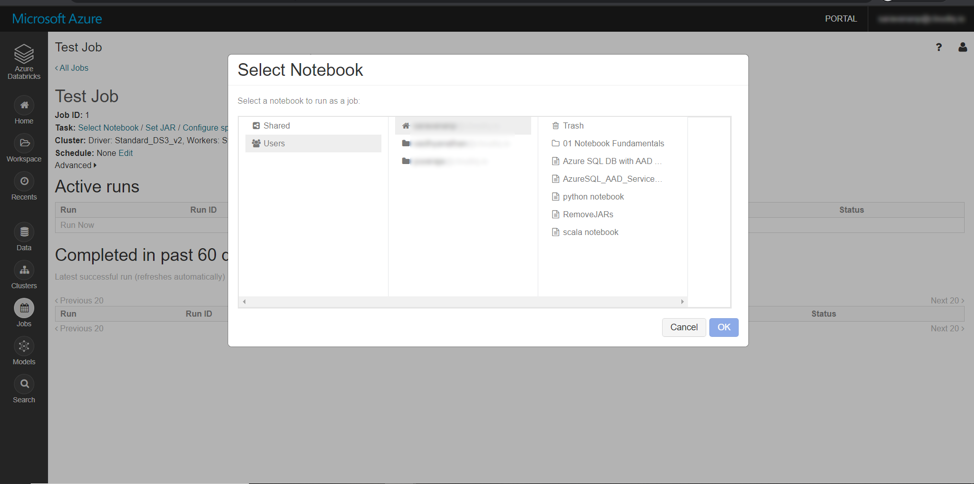
During code development, notebooks are run interactively in the notebook UI.  A job is another way of running a notebook or JAR either immediately or on a scheduled basis.

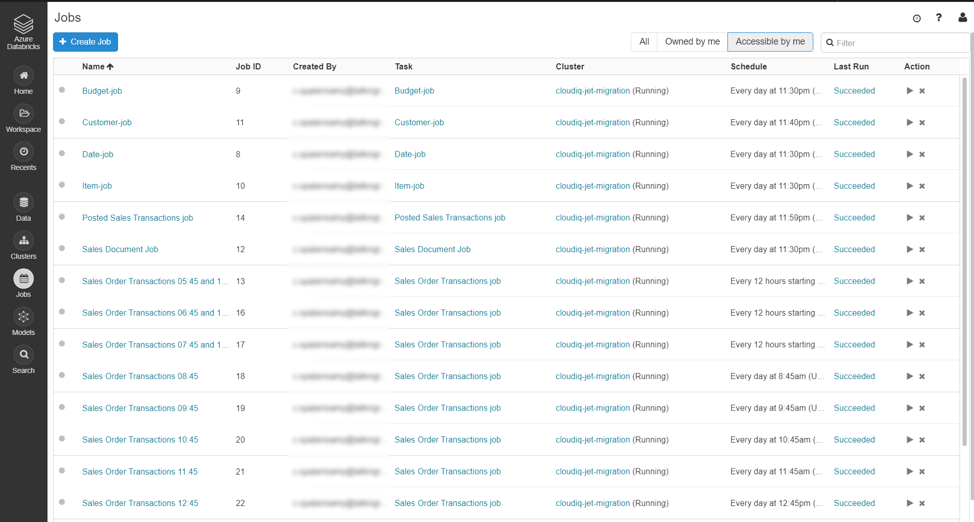
We can create a job by selecting Jobs from the left-side menu and then provide the name of job, notebook to be run, schedule of the job (daily, hourly, etc.)

Once the jobs are scheduled, the jobs can be monitored using the same Jobs menu.

6.   Databases and tables

A Databricks database is a collection of tables. A Databricks table is a collection of structured data. Tables are equivalent to Apache Spark DataFrames. We can cache, filter, and perform any operations supported by DataFrames on tables. You can query tables with Spark APIs and Spark SQL.

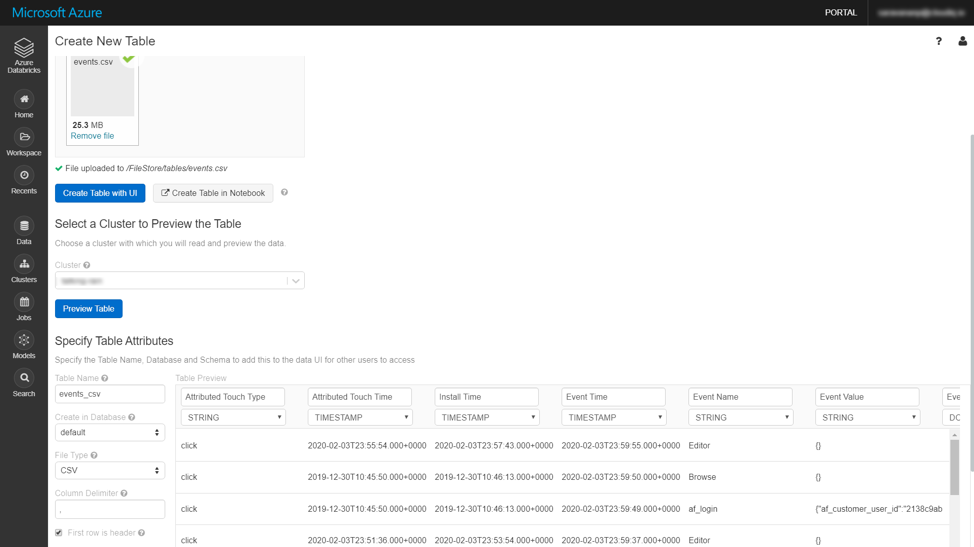
Databricks provides us the option to create new Tables by uploading CSV files; Databricks can even infer the data type of the columns in the CSV file.

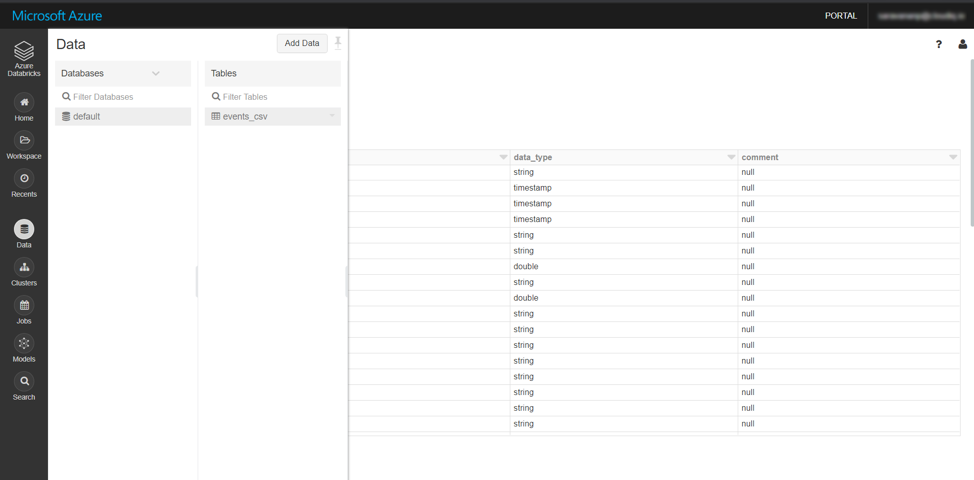
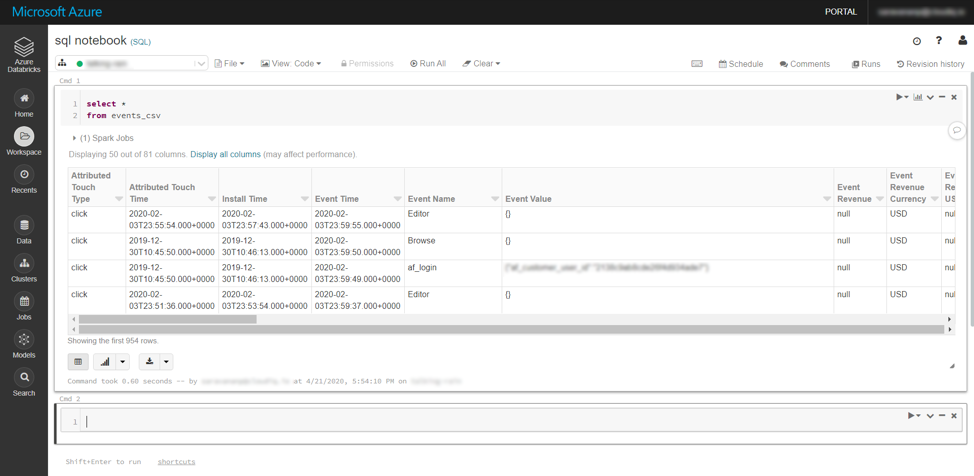
All the databases and tables created either by uploading files (or) through Spark programs can be viewed using the Data menu option in Databricks workspace and these tables can be queried using SQL notebooks.

We hope this article helps you getting started with Azure Databricks. You can now spin up clusters and build quickly in a fully managed Apache Spark environment with the global scale and availability of Azure.

To keep business critical applications running 24/7/365 it is important for organizations to have a sound business continuity and disaster recovery strategy. In this article we will discuss how to set up disaster recovery for Azure VM in secondary region.

We will use Azure Site Recovery that helps manage and orchestrate disaster recovery of on-premises machines and Azure virtual machines (VM), including replication, failover, and recovery.

Pre-requisites,
  1. Recovery services vault
  2. A Virtual machine

ENABLING REPLICATION

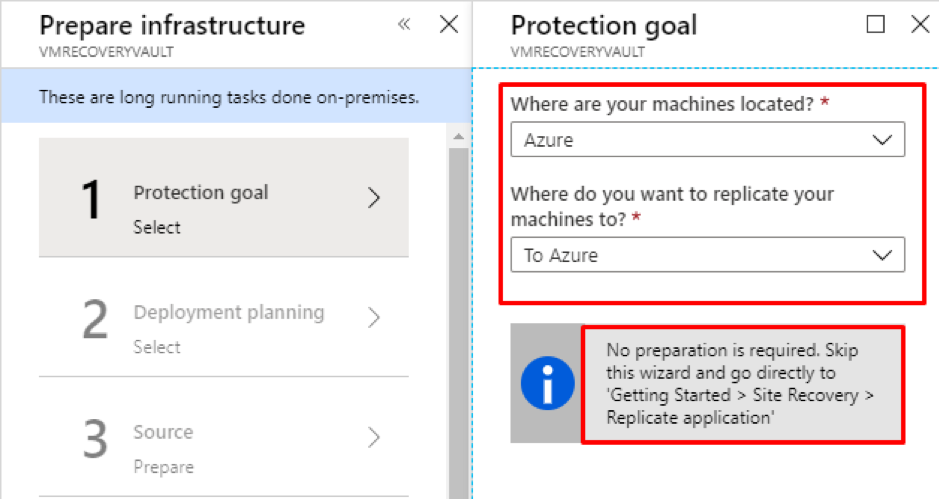
To replicate a VM to secondary region, prepare site recovery infrastructure. In this case we are replicating from one azure region to another.

For replication from Azure to Azure, one can directly go to recovery service vault and replicate the VM.

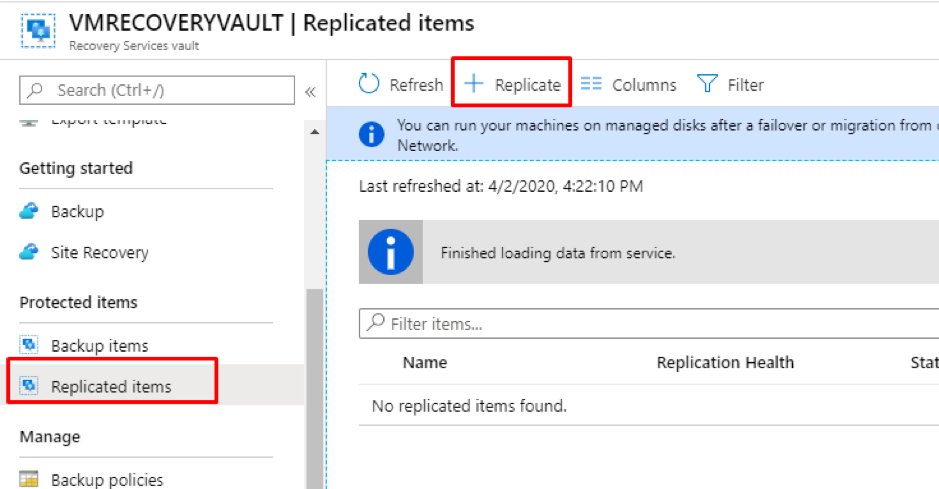
  1. Go to recovery services vault >> Replicated Items
  2. Click on the Replicate icon and follow.

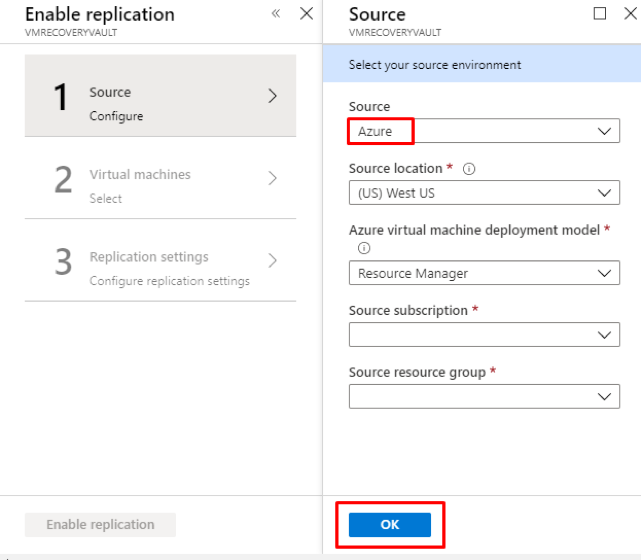
3. Select the following

  • Source: Azure
  • Source location: Region where the VM is deployed
  • Azure virtual machine deployment model: Resource manager
  • Source subscription: Subscription where the VM is deployed
  • Source Resource group: Resource group where the VM is deployed

4. Select OK to proceed to next step.

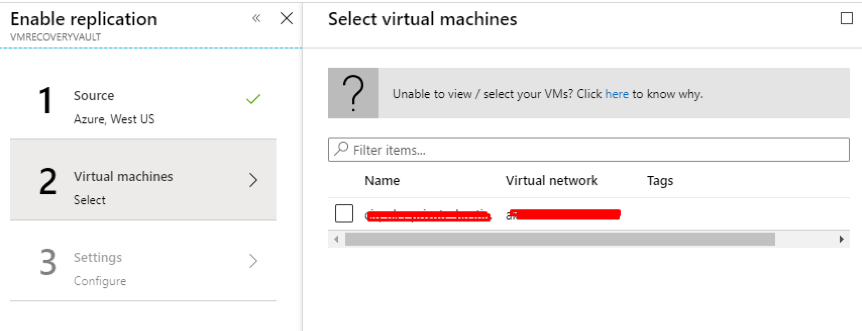
5.Select the VM to replicate

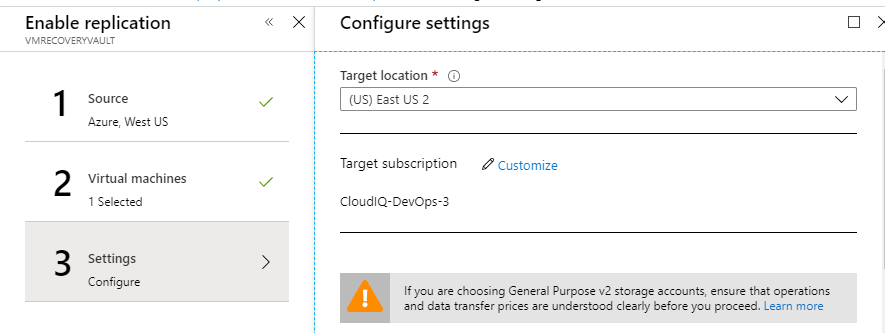
6. Target configurations

  • Target location: Secondary region where the VM is to be replicated
  • Target subscription: Subscription where the VM to be replicated

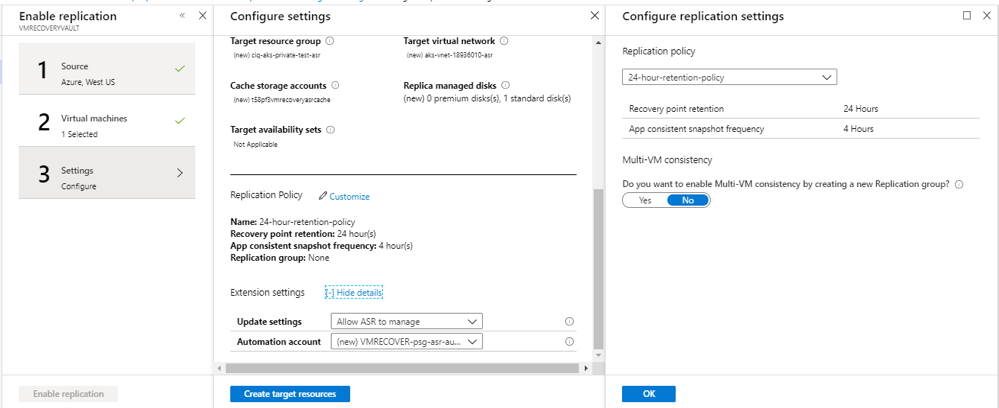
By default, the following resources are created in target region and can be customized per your need

  • Resource group
  • Virtual network
  • Cache storage account
  • Replica managed disks
  • Target availability sets (if applicable)

You can set replication policies and view extension details here

7.Click on create target resources

8.Then select Enable replication

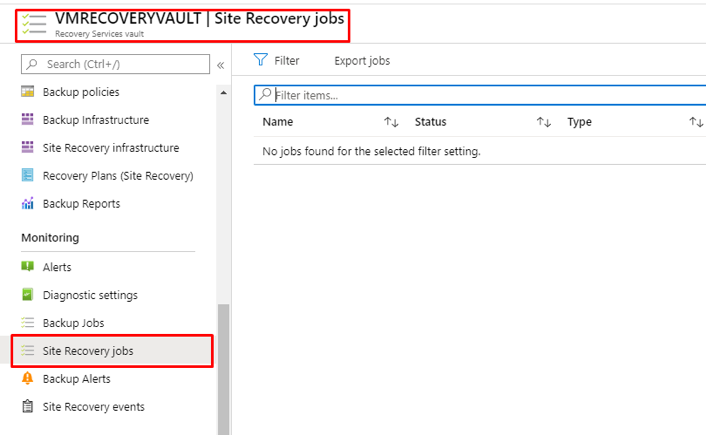
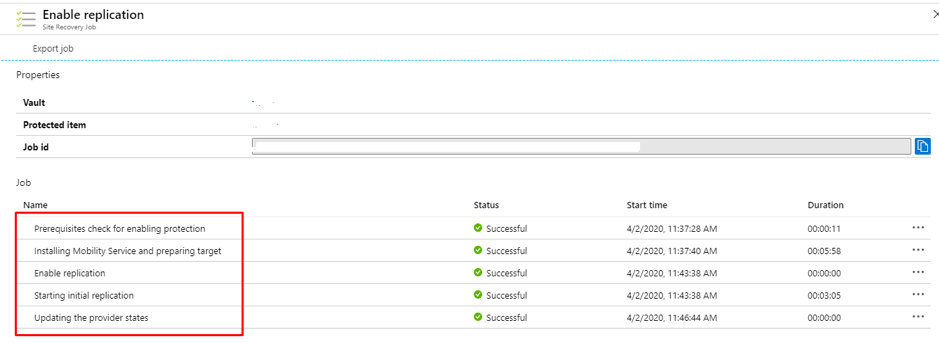
Go to recovery services vault >> Monitoring >> Site recovery Jobs to view the jobs that are running during the replication.

Look for the following jobs

  1. Prerequisites check for enabling protection
  2. Installing Mobility Service and preparing target
  3. Enable replication
  4. Starting initial replication
  5. Updating the provider states

Once the above-mentioned jobs are over, here is what happens

  • Synchronization process begins
  • Waiting for first recovery point
  • The VM is protected

Once all processes are completed, you can view the VM by going to recovery services vault >> Replicated Items

KEXP is known internationally for their music and authenticity. To help bring their global audience the music they want, KEXP needed to find a solution that could bring all of their services online. While they eventually accomplished their goal, they did run into roadblocks along the way.

Your partners at CloudIQ Technologies and Microsoft can help you overcome any obstacle. With years of industry experience, you can be rest assured knowing your custom IT solution will be up and running in no time. Contact us today to find out more on how we can help.

Cloud security is a major challenge for organizations running mission critical applications on cloud. One of the biggest risks from hackers come via open ports, and Microsoft Azure Security Center provides a great option to manage this threat – Just-in-Time VM access!

What is Just-in-Time VM access?

With Just-in-Time VM access, you can define what VM and what ports can be opened and controlled and for how long. The Just-in-Time access locks down and limits the ports of Azure virtual machines in order to overcome malicious attacks on the virtual machine, therefore only providing access to a port for a limited amount of time. Basically, you block all inbound traffic at the network level.

When Just-In-Time access is enabled, every user’s request for access will be routed through Azure RBAC, and access will be granted only to users with the right credentials. Once a request is approved, the Security Center automatically configures the NSGs to allow inbound traffic to these ports – only for the requested amount of time, after which it restores the NSGs to their previous states.

The just-in-time option is available only for the standard security center tier and is only applicable for VMs deployed via Azure resource manager.

What are the permissions needed to configure and use JIT?
To enable a user to:Permissions to set
Configure or edit a JIT policy for a VMAssign these actions to the role:
On the scope of a subscription or resource group that
is associated with the VM: Microsoft.Security/locations/jitNetworkAccessPolicies/write
On the scope of a subscription or resource group of VM: Microsoft.Compute/virtualMachines/write
Request JIT access to a VMAssign these actions to the user:
On the scope of a subscription or resource group that is associated with the VM:
Microsoft.Security/locations/jitNetworkAccessPolicies/initiate/action
On the scope of a subscription or resource group that is associated with the VM:
Microsoft.Security/locations/jitNetworkAccessPolicies/*/read
On the scope of a subscription or resource group or VM: Microsoft.Compute/virtualMachines/read
On the scope of a subscription or resource group or VM:
Microsoft.Network/networkInterfaces/*/read

Why Just-in-Time access?

Consider the scenario where a virtual machine is deployed in Azure, and the management port is opened for all IP addresses all the time. This leaves the VM open for brute force attack.

The brute force attack is usually targeted to Management ports like SSH (22) and RDP (3389). If the attacker compromises the security, the whole VM will be open to them. Even though we might have NSG firewalls enabled in our Azure infrastructure, it’s best to limit the exposure of management port within the team for a limited amount of time.

How to enable JIT?

Just-In-Time access can be implemented in two ways,

  1. Go to Azure security center and click on Just-in-Time VM

2. Go to the VM, then click on configuration and “Enable JIT”

How to set up port restrictions?

Go to Azure security center and click on recommendations for Compute &Apps.

Select the VM and click Enable JIT on VMs.

It will then show a list of recommended ports. It is possible to add additional ports as per requirement. The default port list is show below.

Now click on the port that you wish to restrict. A new tab will appear with information on the protocol to be allowed, allowed source IP (per IP address, or a CIDR range).

The main thing to note is the request time. The default time is 3 hours; it can be increased or decreased as per the requirement. Then click, OK.

Click OK and the VM will appear in the Just-in-Time access window in the security center.

What changes will happen in the infrastructure when JIT is enabled?

The Azure security center will create a new Deny rule with a priority less than the original Management port’s Allow rule in the Network security group’s Inbound security rule.

If the VM is behind an Azure firewall, the same rule overwrite occurs in the Azure firewall as well.

How to connect to the JIT enabled VM?

Go to Azure security center and navigate to Just-in-Time access.

Select the VM that you need to access and click on “Request Access”

This will take you to the next page where extra details need to be provided for connectivity such as,

  1. Click ON Toggle
  2. Provide Allowed IP ranges
  3. Select time range
  4. Provide a justification for VM Access
  5. Click on Open Ports

This process will overwrite the NSG Deny rule and create a new Allow rule with less priority than the Deny All inbound rule or the selected port.

The above-mentioned connectivity process includes two things

  1. IP Range
  2. My IP options

IP Range:

In this option, we can provide either a single IP or a CIDR block.

MY IP:

Case 1: If you’re connected to Azure via a public network, i.e., without any IP sec tunnel, while selecting MY IP, the IP address that is to be registered will be the Public IP address of the device you’re connecting from.

Case 2: If you’re connected to Azure via a VPN/ IP Sec tunnel/ VNET Gateway, you can’t possibly use MY IP option. Since the MY IP option directly captures the Public IP and it can’t be used. In this scenario, we need to provide the private IP address of VPN gateway for a single user, or to allow a group of users, provide private IP CIDR Block of the whole organization.

How to monitor who’s requested the access?

The users who request access are registered as Activity. To view the activities in Log analytics workspace, link the Subscription Activity to Log analytics.

It is possible to view the list of users accessed in the log analytics workspace with the help of Kusto Query Language(KQL), once it is configured to send an activity log to log analytics.

In September 2019, Azure announced a brand-new service – Azure Private Link, a very important tool for service providers providing a mix of Azure IaaS and PaaS services.

Azure Private Link enables you to access Azure PaaS Services (for example, Azure Storage and SQL Database) and Azure-hosted customer-owned/partner services over a Private Endpoint in your virtual network. Traffic between your virtual network and the service traverses over the Microsoft backbone network, eliminating exposure from the public Internet. It can be used via a local IP address (on Azure and from on-premises networks) or via a dedicated Azure ExpressRoute network.

Well, naturally, the first benefit is security!  It reduces the exposure of PaaS services to the Internet and provides a secure way to manage traffic between the client’s network and Azure. With Private Link Service, data stays within Microsoft’s system and the client’s private network.

For service providers and their clients, this is obviously critical as it provides secure access to customers in their virtual network while giving them the ability to use the resources in the service provider’s subscription.

Find out how a Private Link Service can be created behind a standard load balancer.

In the example below, Kubernetes Ingress Service is exposed as a Private Link Service. The ingress has a Standard Load Balancer with IP Address 172.17.1.100.

Details of Ingress Service (Internal Load Balancer) 

cloudiq@hubandspoke:~$ kubectl get service -A | grep  LoadBalancer
dev                ciq-demo-ingress-nginx-ingress-
controller        LoadBalancer   192.168.3.11    172.17.1.100     80:32314/TCP,443:30694/TCP   43h

Service can be accessed as below from within the VNET(ciq-demo-vnet)

http://172.17.1.100/web/api/imageresult
Added this method for testing this API in API-MGMT. The current time is : 02/20/2020 10:07:23

The private Link service is created with the following details.

  • Alias – It is a unique URI identifying the service and can be accessed from anywhere within Azure.
  • NAT IP – This determines the Source IP and Destination IP of incoming and outgoing packets to the Private Link service, respectively. This NAT IP can be within any subnet of the service provider VNET

Next, you create a private endpoint in the consumer vnet/subnet. In our example, we have created a network interface in the ciq-devops-general-rq-vnet/default vnet/subnet. The private ip within the vnet/subnet is 10.0.0.4. The Kubernetes ingress service can be accessed from the consumer vnet using the 10.0.0.4 private IP.

cloudiq@cloudiq-build-agent-vm:~$ curl http://10.0.0.4/web/api/imageresult
Added this method for testing this API in API-MGMT. The current time is : 02/20/2020 10:09:03

Private Link can be enabled for other Azure Resources, such as below.

For example, the private endpoint was enabled for a Storage account.

cloudiq@cloudiq-build-agent-vm:~$ curl http://k8sworkshopstg.blob.core.windows.net/test/hw.txt

Hello World!

cloudiq@cloudiq-build-agent-vm:~$ nslookup k8sworkshopstg.blob.core.windows.net
Server:         127.0.0.53
Address:        127.0.0.53#53

Non-authoritative answer:
k8sworkshopstg.blob.core.windows.net    canonical name = k8sworkshopstg.privatelink.blob.core.windows.net.
Name:   k8sworkshopstg.privatelink.blob.core.windows.net
Address: 10.0.0.5

cloudiq@cloudiq-build-agent-vm:~$ curl http://k8sworkshopstg.privatelink.blob.core.windows.net/test/hw.txt

Hello World!

Cybersecurity is the number one concern for CEOs and is unanimously seen as the biggest threat in the coming years. Reports suggest that the damages from cyberattacks will to amount to $6 trillion annually by 2021.

While a lot of news coverage is given to malicious hackers and ransomware attacks, another crucial area of cyber protection is tightening the internal defenses with intelligent identity management. Keeping a tight control on who can get past your firewalls is vital for maintaining optimum security.

In this article we will review the comprehensive set of security tools available in Azure Cloud.

Azure Active Directory

Multi-Factor Authentication

Azure Multi-Factor Authentication (MFA) helps safeguard access to data and applications while maintaining simplicity for users. It provides additional security by requiring a second form of authentication and delivers strong authentication via a range of easy to use authentication methods. Users may or may not be challenged for MFA based on configuration decisions that an administrator makes.

The security of two-step verification lies in its layered approach. Compromising multiple authentication factors presents a significant challenge for attackers. Even if an attacker manages to learn the user’s password, it is useless without also having possession of the additional authentication method. It works by requiring two or more of the following authentication methods: Something you know (typically a password), Something you have (a trusted device that is not easily duplicated, like a phone), Something you are (biometrics)

Conditional Access policies

Conditional Access is the tool used by Azure Active Directory to bring signals together, to make decisions, and enforce organizational policies. Conditional Access policies at their simplest are if-then statements; if a user wants to access a resource, then they must complete an action. Example: A payroll manager wants to access the payroll application and is required to perform multi-factor authentication to access it.

Azure AD identity protection

Identity Protection is a tool that allows organizations to accomplish three key tasks: Automate the detection and remediation of identity-based risks, Investigate risks using data in the portal, Export risk detection data to third-party utilities for further analysis. The signals generated by and fed to Identity Protection, can be further fed into tools like Conditional Access to make access decisions, or fed back to a security information and event management (SIEM) tool for further investigation based on your organization’s enforced policies.

Azure AD Privileged Identity Management

Privileged Identity Management provides time-based and approval-based role activation to mitigate the risks of excessive, unnecessary, or misused access permissions on resources that you care about. Here are some of the key features of Privileged Identity Management:

  • Provide just-in-time privileged access to Azure AD and Azure resources
  • Assign time-bound access to resources using start and end dates
  • Require approval to activate privileged roles
  • Enforce multi-factor authentication to activate any role
  • Use justification to understand why users activate
  • Get notifications when privileged roles are activated
  • Conduct access reviews to ensure users still need roles
  • Download audit history for internal or external audit

Network Security

Network Security Groups (NSGs)

Network security group security rules are evaluated by priority using the 5-tuple information (source, source port, destination, destination port, and protocol) to allow or deny the traffic. A flow record is created for existing connections. Communication is allowed or denied based on the connection state of the flow record. The flow record allows a network security group to be stateful. If you specify an outbound security rule to any address over port 80, for example, it’s not necessary to specify an inbound security rule for the response to the outbound traffic. You only need to specify an inbound security rule if communication is initiated externally. The opposite is also true. If inbound traffic is allowed over a port, it’s not necessary to specify an outbound security rule to respond to traffic over the port. Existing connections may not be interrupted when you remove a security rule that enabled the flow. Traffic flows are interrupted when connections are stopped, and no traffic is flowing in either direction, for at least a few minutes.

Azure Firewall

With Azure Firewall, you can configure – Application rules that define fully qualified domain names (FQDNs) that can be accessed from a subnet and Network rules that define source address, protocol, destination port, and destination address. Network traffic is subjected to the configured firewall rules when you route your network traffic to the firewall as the subnet default gateway.

Application security groups

Application security groups enable you to configure network security as a natural extension of an application’s structure, allowing you to group virtual machines and define network security policies based on those groups. You can reuse your security policy at scale without manual maintenance of explicit IP addresses. The platform handles the complexity of explicit IP addresses and multiple rule sets, allowing you to focus on your business logic.

Resource management security

Azure resource locks

As an administrator, you may need to lock a subscription, resource group, or resource to prevent other users in your organization from accidentally deleting or modifying critical resources. You can set the lock level to CanNotDelete or ReadOnly. In the portal, the locks are called Delete and Read-only, respectively. CanNotDelete means authorized users can still read and modify a resource, but they can’t delete the resource. ReadOnly means authorized users can read a resource, but they can’t delete or update the resource. Applying this lock is similar to restricting all authorized users to the permissions granted by the Reader role.

Azure policies

Azure Policy is a service in Azure that you use to create, assign, and manage policies. These policies enforce different rules and effects over your resources, so those resources stay compliant with your corporate standards and service level agreements. Azure Policy meets this need by evaluating your resources for non-compliance with assigned policies. All data stored by Azure Policy is encrypted at rest. For example, you can have a policy to allow only a certain SKU size of virtual machines in your environment. Once this policy is implemented, new and existing resources are evaluated for compliance.

Custom RBAC roles

Granting permission using custom Azure AD roles is a two-step process that involves creating a custom role definition and then assigning it using a role assignment. A custom role definition is a collection of permissions that you add from a preset list. These permissions are the same permissions used in the built-in roles.

Once youíve created your role definition, you can assign it to a user by creating a role assignment. A role assignment grants the user the permissions in a role definition at a specified scope. This two-step process allows you to create a single role definition and assign it many times at different scopes. A scope defines the set of Azure AD resources the role member has access to.

Encryption for data at rest

Azure SQL Database Always Encrypted

Always Encrypted is a new data encryption technology in Azure SQL Database and SQL Server that helps protect sensitive data at rest on the server during movement between client and server, and while the data is in use, ensuring that sensitive data never appears as plaintext inside the database system. After you encrypt data, only client applications or app servers that have access to the keys can access plaintext data.

Implement database encryption

Transparent data encryption (TDE) helps protect Azure SQL Database, Azure SQL Managed Instance, and Azure Data Warehouse against the threat of malicious offline activity by encrypting data at rest. It performs real-time encryption and decryption of the database, associated backups, and transaction log files at rest without requiring changes to the application. By default, TDE is enabled for all newly deployed Azure SQL databases.

Implement Storage Service Encryption

Data in Azure Storage is encrypted and decrypted transparently using 256-bit AES encryption, one of the strongest block ciphers available, and is FIPS 140-2 compliant. Azure Storage encryption is similar to BitLocker encryption on Windows.

Azure Storage encryption is enabled for all new storage accounts, including both Resource Manager and classic storage accounts. Azure Storage encryption cannot be disabled. Because your data is secured by default, you don’t need to modify your code or applications to take advantage of Azure Storage encryption.

Implement disk encryption

Azure Disk Encryption helps protect and safeguard your data to meet your organizational security and compliance commitments. It uses the Bitlocker feature of Windows to provide volume encryption for the OS and data disks of Azure virtual machines (VMs), and is integrated with Azure Key Vault to help you control and manage the disk encryption keys and secrets.

Configure application security

Configure SSL/TLS certs

If you purchase an App Service Certificate from Azure, Azure manages the following tasks: Takes care of the purchase process from GoDaddy, Performs domain verification of the certificate, Maintains the certificate in Azure Key Vault, Manages certificate renewal (see Renew certificate), Synchronize the certificate automatically with the imported copies in App Service apps.

Configure and Manage Key Vault

Manage access to Key Vault

Azure Key Vault is a cloud service that safeguards encryption keys and secrets like certificates, connection strings, and passwords. Because this data is sensitive and business-critical, you need to secure access to your key vaults by allowing only authorized applications and users.

Access to a key vault is controlled through two interfaces: the management plane and the data plane. The management plane is where you manage Key Vault itself. Operations in this plane include creating and deleting key vaults, retrieving Key Vault properties, and updating access policies. The data plane is where you work with the data stored in a key vault. You can add, delete, and modify keys, secrets, and certificates.

To access a key vault in either plane, all callers (users or applications) must have proper authentication and authorization. Authentication establishes the identity of the caller. Authorization determines which operations the caller can execute.

Both planes use Azure Active Directory (Azure AD) for authentication. For authorization, the management plane uses role-based access control (RBAC), and the data plane uses a Key Vault access policy.

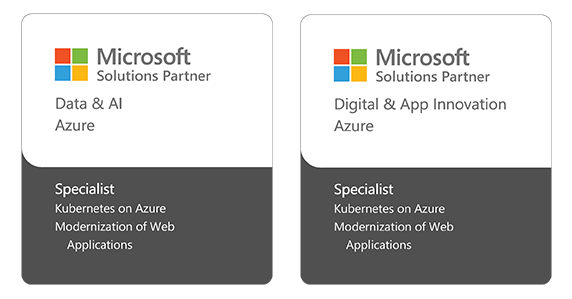
As more and more organizations run their business-critical applications on containers using Azure, there are new challenges in monitoring and managing them. Of course, there is the Azure dashboard, but with elaborate set-ups and such, IT teams feel the need for a more intuitive dashboard to monitor and track Azure services.

The answer, Grafana.

Grafana is an open-source dashboard and graph editor for Graphite, Elasticsearch, OpenTSDB, Prometheus, and InfluxDB. It is a powerful visualization application that deals effectively with large-scale measurement data and time-series data.

As compared to other dashboards, especially the native Azure dashboard, Grafana offers a wider variety of visualization options (graphs, heatmaps, tables, and more) and can collect and collate data from multiple sources. It is designed for evaluating metrics such as system CPU, memory, disk, and I/O utilization.

A Grafana dashboard will help you understand, analyze, monitor, and explore your data with flexible and fast visualization tools.

In this article we will look at using Azure Database for MySQL and Grafana to monitor Azure services

Access Requirements

In your Azure subscription, your account must have “Microsoft.Authorization/*/Write” access to assign and AD app to a role. This action is granted through “Owner” role or “User Access Administrator” role. “Contributor” role will not have the required permissions.

Virtual machine requirements,
  • VM Operating System      :  Linux (ubuntu 18.04)
  • VM Size                                   :  Standard D2s v3 (2 vcpus, 8 GiB memory) is more than enough
  • SSH access                            :  username and password.
  • Default port                       :  3000
  • NSG rule                                 :  open an inbound rule in network security group with
                                                        limited access to port 3000 and 22 for SSH.
  • Assign a static public IP address to the VM

MySQL Creation and Linking to Grafana

1. Create an Azure database for MySQL server from

2. Select the resource group, provide Server name, admin username, password, confirm password. Take a note of the password; it is used several times throughout the set-up.

3. To select compute and storage,

a. There are three pricing tiers, (choose basic)

  • Basic
  • General-purpose
  • Memory-optimized

b. Select the appropriate sizes.

  • Computer generation: Gen 5
  • vCore: 1
  • storage: 5GB
  • Auto-growth:
  • Backup retention period:
  • Local redundant / Geo-Redundant

For basic compute and storage,

The maximum vcore is 2, and Storage is 1024 GB. Choose as per your needs.

4. Then click Review+Create

5. Once the Azure database for MYSQL server is deployed, go to connection security and do the following changes,

  • Add a client IP.
  • Set “Allow access to Azure services” to ON

6. Do the following in the SQL server by connecting to it using the Server admin login name and password in SQL workbench. Create a new query tab. (You can use any tool to connect MySQL)

7. Run the following commands in the query tab,

  • create database named “grafana” ;

8. Now the SQL server-side configurations are over. We need to provide the inputs of SQL server configuration to docker containers running Grafana.

9. Login to the VM running Grafana using appropriate SSH credentials (password or access keys).

10. Note the following values and save them as environment variables as an environment list.

Type                =          mysql
Host                =          <servername>:3306 (mysql server name created earlier)
Name              =          grafana (DB name given in the earlier steps and given access)
User                =          <Server admin login name>
Password       =          <server login password>

11. Save the changes mentioned above as a list. As shown,

Installing Grafana as a docker container and required its plugins

1. Login to the server using appropriate credentials,

2. Get updates using, sudo apt-get update

3. Install docker using the command, sudo apt install docker.io

4. Enable and start docker,

  • sudo systemctl start docker
  • sudo systemctl enable docker

5. Verify the installation using the command,

  • docker –version the result will be like this,

6. Now login as root using the command,

  • sudo su

7. Pull Grafana image; this needs an Internet connection as this will download the image from a public hub of docker

  • docker pull grafana/grafana

8. Run the image with saved environment variables,

  • docker run -d –name=grafana -p 8000:3000 –env-file ./env.list grafana/grafana

9. verify the container installation using “docker ps” command

10. The next step is to install the plugins for Grafana, which will be used in setting up the dashboard. We need to login to the container created previously to install these plugins.

11. Now create a shell inside the container using,

  • docker exec -it grafana /bin/bash

12. The result will be as shown,

13. By default, in Grafana dashboard there’ll be limited number of panel plugins, to use more visualization we can manually install plugins. Now copy the plugin installation commands listed below and run them one by one or everything at once.

  • grafana-cli plugins install michaeldmoore-annunciator-panel
  • grafana-cli plugins install grafana-piechart-panel
  • grafana-cli plugins install farski-blendstat-panel
  • grafana-cli plugins install michaeldmoore-multistat-panel
  • grafana-cli plugins install grafana-polystat-panel
  • grafana-cli plugins install flant-statusmap-panel
  • grafana-cli plugins install grafana-clock-panel
  • grafana-cli plugins install neocat-cal-heatmap-panel
  • grafana-cli plugins install briangann-gauge-panel
  • grafana-cli plugins install natel-plotly-panel

14. Once the plugins are installed,

  • verify the installation by going into, /var/lib/grafana/plugins directory by using the commands listed below
  • cd  /var/lib/grafana/plugins
  • to view installed plugins, use ls command

15. Now exit the container, command: exit

16. Now restart the container using,

  • docker container restart Grafana (here “grafana” refers to the container name created earlier, which can be found using docker ps command)

Linking Azure Monitoring Tools

Service Principal

  • Register an app in Azure Active Directory (AD).
  • Create a client secret in the Registered app.
  • Go to subscription à IAM à search for the app registration and provide “READER” access to the registered app in the Azure AD in first place.

Applying the service principal to Grafana,

  • Go to Grafana UI by using public IP address followed by port number,
    i.e., (IP address):3000 example: 13.25.49.164:3000
  • Now Add data source. And click select
  • This page will appear, input the tenant ID, client ID, client secret.
  • Then provide details for log analytics workspace and Application insights.
  • If the provided details are correct this message should be displayed.

Cosmos DB is Microsoft Azure’s hugely successful tool to help their clients manage data on a global scale. This multi-model database service allows Azure platform users to elastically and independently scale throughput and storage across any number of Azure regions worldwide.

As Cosmos DB supports multiple data models, you can take advantage of fast, single-digit-millisecond data access using any of your favorite APIs, including SQL, MongoDB, Cassandra, Tables, or Gremlin. Being a NoSQL database, anyone with experience in MongoDB can easily work with Cosmos DB. Meanwhile, by supporting SQL APIs, it makes it easy to interact with SQL knowledge.

Why Cosmos DB?

For organizations looking to build a flexible and scalable database that is globally distributed, Cosmos DB is especially useful as it

  • provides a ready-to-use, extremely dynamic database service
  • guarantees low latency of less than 10 milliseconds when reading data and less than 15 milliseconds when writing data.
  • offers customers a faster, completely seamless experience.
  • offers 99.99% availability

Here are some tried and tested tips from our senior Azure expert on how to get the most out of Cosmos DB.

Data Modeling

Cosmos DB is great because it lets you model semi/unstructured aggregates and dynamic entities. This means it’s very easy to model ever-changing entities, entities that don’t all share the same attributes and hierarchical aggregates. To model for Cosmos, you need to think in terms of hierarchy and aggregates instead of entities and relations. NoSQL lets you, say, store a thing that has other things, which have things of their own. Give me the whole hierarchy of things back. So, you don’t have a person, rental addresses, and a relation between them. Instead, you have rental records, which aggregate for each person what rental addresses they’ve had.

The following NO SQL rules will perfectly match cosmos DB too.

  • Should be used as a complement to an existing or additional database.
  • Deal with PACELC theorem, an extension of CAP theorem.
  • A data modeler should think in terms of queries instead of in terms of storage
Connection Types

Cosmos DB can be connected to the application by 2 modes.

  • Gateway mode
  • Direct mode

The gateway mode is the default mode in Microsoft.Azure.DocumentDB SDK. It uses HTTPS port with a single endpoint. While the direct mode is the default for .NET V3 SDK. This uses TCP and HTTPS for connectivity.

The gateway mode is better while your application runs within a corporate network with strict network rules because it has a single endpoint that can be configured to the firewall for security. Meanwhile, the gateway mode performance will be low when compared to the direct mode.

There is also an option to connect through a RESTful programming model provided by the SDK. All the CRUD can be done through REST calls. This method is recommended if you need a client App to do database access directly instead of providing API. Thus, the overhead of providing an API wrapper to consume the Cosmos DB can be eradicated, and a performance payoff can be prevented.

The recommended mode is always the direct mode in most of the scenarios, which provides better performance.

I am taking the popular volcano data for comparing the response time between the SDK and RESTful model.

Query Executed in both the versions.

SELECT * FROM c where c.Status="Holocene"
Response details of the SDK

The query was responded with the data in 3710 ms.

Response details of the RESTful model

The query was responded with data in 5810 ms.

If we developed an API with this mode, then the response time taken by our API, too needs to be considered. So, using RESTful model in API will be a trade-off with the performance. Use this mode to query from the client directly.

Partitioning the DB

The logical partition is the primary key to provide performance to the cosmos transactions. For example, if you have a database with a list of student data of around 1500 from a school. Now, a simple search for a student named “Peter” will lead to a search through all the 1500 data entries, which consumes high throughput to get the result. Now split the data logically by the “Grade” they belong to. Now, querying like a student named “Peter” from “Grade 5” will lead the system to search only 30 or 40 students from the total 1500 saving the throughput consumption and elevating the performance as compared to the earlier approach.

The common phenomenon will be a. Any key such as city, state, country kind of properties can be used as Partition Key.

a. Any key such as city, state, country kind of properties can be used as Partition Key.
 b. No partition is required up to 10 GB.
 c. The query must be provided with the partition key to be searched.
 d. The property selected as partition key must be in all the documents in the container.

I am taking the popular Volcano data for testing the performance with and without Partition Key.

1. I initially created a collection without a partition key. The performance for the given query is

SELECT * FROM c where c.Status="Holocene"
Resultset
MetricValue
Partition key range id0
Retrieved document count200
Retrieved document size (in bytes)100769
Output document count200
Output document size (in bytes)101069
Index hit document count200
Index lookup time (ms)0.21
Document load time (ms)1.29
Query engine execution time (ms)0.33
System function execution time (ms)0
User defined function execution time (ms)0
Document write time (ms)0.52

2. Then I recreated the same collection with “/country” as a partition. Now the same query with Japan as partition value results with the given values.

Resultset
MetricValue
Partition key range id0
Retrieved document count16
Retrieved document size (in bytes)7887
Output document count16
Output document size (in bytes)7952
Index hit document count16
Index lookup time (ms)0.23
Document load time (ms)0.17
Query engine execution time (ms)0.06
System function execution time (ms)0
User defined function execution time (ms)0
Document write time (ms)0.01

Tune the Index

Indexing is always a top priority item in the checklist to tune performance. Indexing is an internal job that keeps track of the metadata about the data, which helps in finding the result set data for a query. By default, all the properties of a Cosmos container will be indexed. But it is not necessary as it is a useless overhead to the DB, and also keeping track of a lot of data consumes enough RUs, which is not cost-effective. The better approach is to exclude all the paths from indexing and add only age paths that are used for querying in the application. 

Indexing ModeWith Default IndexingWith Custom Indexing
RU’s Consumed3146.1519.83
Output Doc Count100100
Doc load time (In ms)646.512.32
Query engine execution time (In ms)434.264.96
System function execution time (In ms)57.032.41

Paging

The execution of the query, by default, will return 100 documents. We can increase the number of documents by providing “maxItemCount” value. The maximum size will be 1000 documents. But it is not meaningful to take 1000 documents at a time from the DB except in some scenarios. To improve the performance and to show a crisp result set to the user, always reduce the “maxItemCount”. Unlike SQL databases, pagination is the default behavior in Cosmos. So, even though you are going to provide maximum count as 1000 and the result for the query is going to be more than that, then the Cosmos is going to return a token named “Continuation Token”. This token consists of a unique value that points to the query we did and the page number. If the total result for the query is provided by the Cosmos, then we can do the logic of pagination at the front end. Thus, by reducing the number of documents per response, we can save the throughput consumption, network data transaction, and increase performance.

Throughput Management

RU ’s or Request Units is the common term we always come across when using Cosmos DB. When you read a document from a container or write a document to it, then you are trading an RU with the Cosmos for your operation. It is like currency in our common world. Without money, you can’t buy anything, and without RU, you can’t query anything. You can buy only the items that cost equivalent to or less than the money you have in hand. Similarly, you can query the data that equals the RU’s you have.

If you have large data and if the query needs to traverse deep into the collection, then you need enough RU’s. Adding a property in the index will consume some RU’s. So, if all the properties are indexed, then your RU’s pay off will be high, and you will lack RU’s for querying. So, always add in the index only the properties that are needed while querying.

Index properly, save the RU’s, and utilize it during querying. For example, if you have 100K documents in the container. The Cosmos DB is consuming 1000 RU’s to do a query operation up to 50K documents with the default indexing, then our query will not reach the rest of the 50K documents, and we will never receive them in our result set. If appropriately indexed, the same query will consume only 400 RU’s to penetrate all the 100K documents.

Startup latency

The very first query will always be a bit late because of the time it takes to awaken the connection. To overcome this latency, it is best practice to call “OpenAsync()” in SDK 2 in the beginning while creating the connection.

await client.OpenAsync();
Singleton Connection

The best approach is to connect the DB and keep the connection alive for all the instances of the application. Also, polling the DB within a period will keep the connection alive. This reduces the DB connectivity latency.
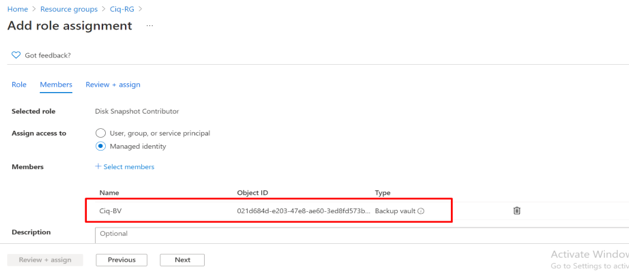
Regions

Make sure the Cosmos and the applications are grouped within the same Azure Region. This reduces the latency a lot. The lowest possible latency is achieved by ensuring the calling application is located within the same Azure region as the provisioned Azure Cosmos DB endpoint.

Programming Best Practices
  • Always use the latest SDK version.
  • Use Streaming API (in SDK 3) that can receive and return data without serializing. Helpful when your API is just a relay and not doing any logical operations on the data.
  • Tune the queries.
  • Implement retry logic with reasonable waiting time to prevent throttle during a busy time.

By carefully analyzing all the above factors, we can improve the Cosmos DB query performance substantially.
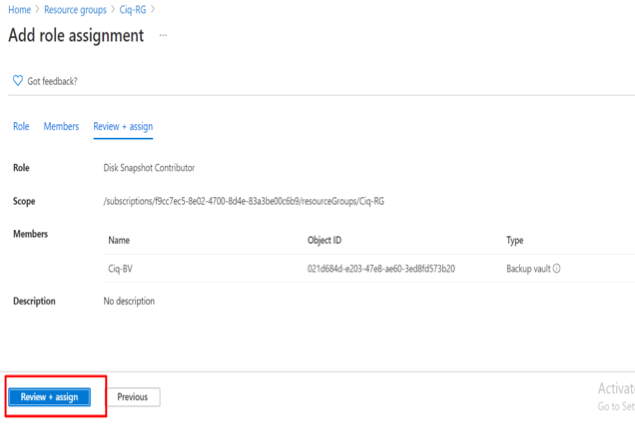
As organizations start to create and maintain clusters in AKS (Azure Kubernetes Service), they also need to use cloud-based identity and access management service to access other Azure cloud resources and services. The Azure Active Directory (AAD) pod identity is a service that gives users this control by assigning identities to individual pods.  
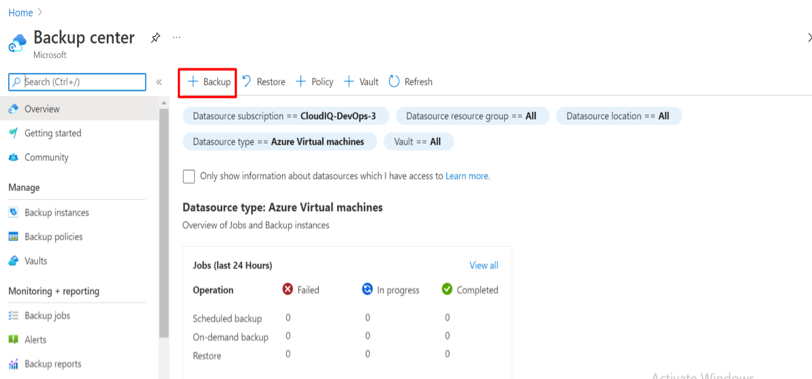
Without these controls, accounts may get access to resources and services they don’t require. And it can also become hard for IT teams to track which set of credentials were used to make changes.

Azure AD Pod identity is just one small part of the container and Kubernetes management process and as you delve deeper, you will realize the true power that Kubernetes and Containers bring to your DevOps ecosystem.

Here is a more detailed look at how to use AAD pod identity for connecting pods in AKS cluster with Azure Key Vault.

Pod Identity

Integrate your key management system with Kubernetes using pod identity. Secrets, certificates, and keys in a key management system become a volume accessible to pods. The volume is mounted into the pod, and its data is available directly in the container file system for your application.
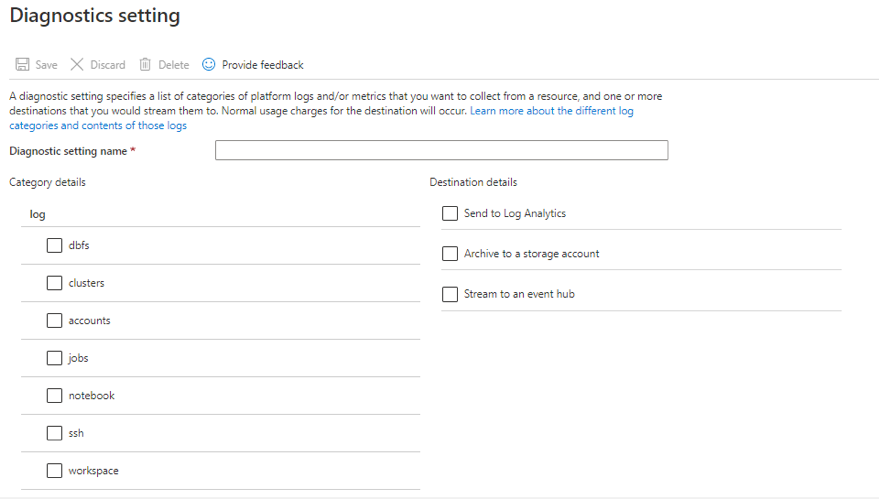
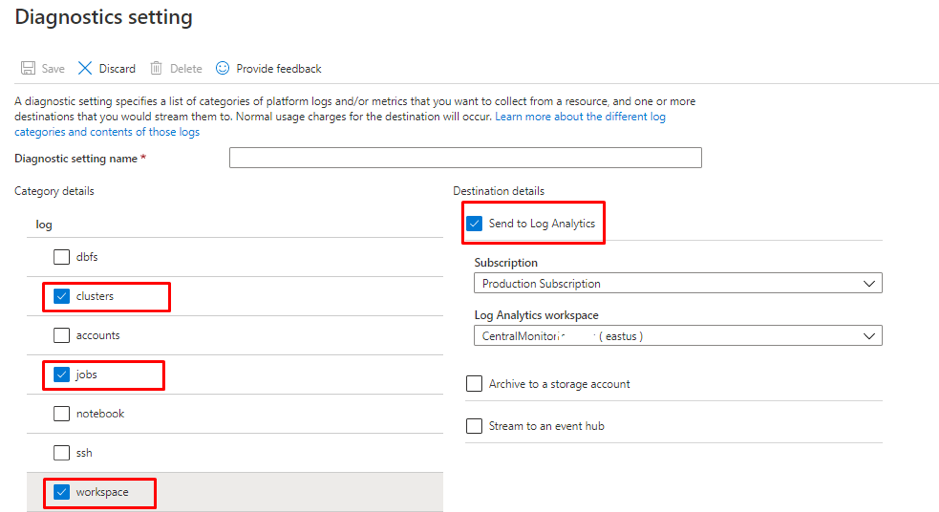
On an existing AKS cluster –

Deploy Key Vault FlexVolume to your AKS cluster with this command:

  • kubectl create -f https://raw.githubusercontent.com/Azure/kubernetes-keyvault-flexvol/master/deployment/kv-flexvol-installer.yaml
1. Create the Deployment

Run this command to create the aad-pod-identity deployment on an RBAC-enabled cluster:

  • kubectl apply -f https://raw.githubusercontent.com/Azure/aad-pod-identity/master/deploy/infra/deployment-rbac.yaml

Or run this command to deploy to a non-RBAC cluster:

  • kubectl apply -f https://raw.githubusercontent.com/Azure/aad-pod-identity/master/deploy/infra/deployment.yaml
2. Create an Azure Identity

Create azure managed identity

Command:- az identity create -g ResourceGroupNameOfAKsService -n aks-pod-identity(ManagedIdentity)

Output:-  

{
"clientId": "xxxxxxxx-xxxx-xxxx-xxxx-xxxxxxxxxxxx ",
"clientSecretUrl": "https://control-westus.identity.azure.net/subscriptions/xxxxxxxx-xxxx-xxxx-xxxx-xxxxxxxxxxxx/resourcegroups/aks_dev_rg_wu/providers/Microsoft.ManagedIdentity/userAssignedIdentities/aks-pod-identity/credentials?tid=xxxxxxxx-xxxx-xxxx-xxxx-xxxxxxxxxxxx&oid=xxxxxxxx-xxxx-xxxx-xxxx-xxxxxxxxx&aid=xxxxxxxx-xxxx-xxxx-xxxx-xxxxxxxxxxxx ",
"id": "/subscriptions/xxxxxxxx-xxxx-XXXX-XXXX-XXXXXXXXXXXX/resourcegroups/aks_dev_rg_wu/providers/Microsoft.ManagedIdentity/userAssignedIdentities/aks-pod-identity",
"location": "westus",
"name": "aks-pod-identity",
"principalId": "XXXXXXXX-XXXX-XXXX-XXXX-XXXXXXXXXXXX",
"resourceGroup": "au10515_aks_dev_rg_wu",
"tags": {},
"tenantId": XXXXXXXX-XXXX-XXXX-XXXX-XXXXXXXXXXX ",
"type": "Microsoft.ManagedIdentity/userAssignedIdentities"
}

Assign Cluster SPN Role

Command for Getting AKSServicePrincipalID:- az aks show -g <resourcegroup> -n <name> –query servicePrincipalProfile.clientId -o tsv

Command:-az role assignment create –role “Managed Identity Operator” –assignee <AKSServicePrincipalId> –scope < ID of Managed identity>

Assign Azure Identity Roles

Command:- az role assignment create –role Reader –assignee <Principal ID of Managed identity> –scope <KeyVault Resource ID>

Set policy to access keys in your Key Vault

Command:- az keyvault set-policy -n dev-kv –key-permissions get –spn  <Client ID of Managed identity>

Set policy to access secrets in your Key Vault

Command:- az keyvault set-policy -n dev-kv –secret-permissions get –spn <Client ID of Managed identity>

Set policy to access certs in your Key Vault

Command:- az keyvault set-policy -n dev-kv –certificate-permissions get –spn <Client ID of Managed identity>

3. Install the Azure Identity

Save this Kubernetes manifest to a file named aadpodidentity.yaml:

apiVersion: "aadpodidentity.k8s.io/v1"
kind: AzureIdentity
metadata:
name: <a-idname>
spec:
type: 0
ResourceID: /subscriptions/<subid>/resourcegroups/<resourcegroup>/providers/Microsoft.ManagedIdentity/userAssignedIdentities/<name>
ClientID: <clientId>

Replace the placeholders with your user identity values. Set type: 0 for user-assigned MSI or type: 1 for Service Principal.

Finally, save your changes to the file, then create the AzureIdentity resource in your cluster:

kubectl apply -f aadpodidentity.yaml

4. Install the Azure Identity Binding

Save this Kubernetes manifest to a file named aadpodidentitybinding.yaml:

apiVersion: "aadpodidentity.k8s.io/v1"
kind: AzureIdentityBinding
metadata:
  name: demo1-azure-identity-binding
spec:
  AzureIdentity: <a-idname>
  Selector: <label value to match>

Replace the placeholders with your values. Ensure that the AzureIdentity name matches the one in aadpodidentity.yaml.

Finally, save your changes to the file, then create the AzureIdentityBinding resource in your cluster:

kubectl apply -f aadpodidentitybinding.yaml

Sample Nginx Deployment for accessing key vault secret using Pod Identity

Save this sample nginx pod manifest file named nginx-pod.yaml:

apiVersion: v1
kind: Pod
metadata:
  labels:
    app: nginx-flex-kv-podid
    aadpodidbinding: 
  name: nginx-flex-kv-podid
spec:
  containers:
  - name: nginx-flex-kv-podid
    image: nginx
    volumeMounts:
    - name: test
      mountPath: /kvmnt
      readOnly: true
  volumes:
  - name: test
    flexVolume:
      driver: "azure/kv"
      options:
        usepodidentity: "true"         # [OPTIONAL] if not provided, will default to "false"
        keyvaultname: ""               # the name of the KeyVault
        keyvaultobjectnames: ""        # list of KeyVault object names (semi-colon separated)
        keyvaultobjecttypes: secret    # list of KeyVault object types: secret, key or cert (semi-colon separated)
        keyvaultobjectversions: ""     # [OPTIONAL] list of KeyVault object versions (semi-colon separated), will get latest if empty
        resourcegroup: ""              # the resource group of the KeyVault
        subscriptionid: ""             # the subscription ID of the KeyVault
        tenantid: ""            # the tenant ID of the KeyVault
Azure AD Pod Identity points to remember when implementing in cluster
  • Azure AD Pod Identity is currently bound to the default namespace. Deploying an Azure Identity and it’s binding to other namespaces, will not work!
  • Pods from all namespaces can be executed in the context of an Azure Identity deployed to the default namespace (related to point 1)
  • Every Pod Developer can add the aadpodidbinding label to his/her pod and use your Azure Identity
  • Azure Identity Binding is not using default Kubernetes label selection mechanism

As one of the most popular cloud platforms, Microsoft Azure is the backbone of thousands of businesses – 80% of the Fortune 500 companies are on Microsoft cloud, and Azure holds 31% of the global cloud market! 

Microsoft’s customer-centricity shines through the entire Azure stack, and a critical part of it is the Azure Alerts that allows you to monitor the metrics and log data for the whole stack across your infrastructure, application, and Azure platform.

Azure Alerts offers organizations and IT managers, access to faster alerts and a unified monitoring platform. Once set up, the software requires minimal technical effort and gives the IT team a centralized monitoring experience through a single dashboard that manages ALL the alerts.

The platform is designed to provide low latency log alerts and metric alerts which gives IT managers the opportunity to identify and fix production and performance issues almost in real-time. Naturally, in complex IT environments, this level of control and overview of the IT infrastructure leads to higher productivity and reduced costs.

Here are more details of how Azure Alerts work

Alerts proactively notify us when important conditions are found in your monitoring data. They allow us to identify and address issues before the users notice them.

This diagram represents the flow of alerts

Alerts can be created from

  • Metric values of resources
  • Log search queries results
  • Activity log events
  • Health of the underlying Azure platform

This is what a typical alert dashboard for a single/multiple subscriptions looks like

You can see 5 entities on the dashboard
  • Severity
    • Defines how severe the alert is and how quickly action needs to be taken.
  • Total alerts
    • Total number of alerts received aggregated by the severity of the alert.
  • New
    • The issue has just been detected and hasn’t yet been reviewed.
  • Acknowledged
    • An administrator has reviewed the alert and started working on it.
  • Closed
    • The issue has been resolved. After an alert has been closed, you can reopen it by changing it to another state.

We will now take you through the steps to create Metric Alerts, Log Search Query Alerts, Activity Log Alerts, and Service Health Alerts.

STEPS TO CREATE A METRIC ALERT

Go to Azure monitor. Click ‘alerts’ found on the left side.

To create a new alert, click on the ‘+ New alert rule’.

After clicking ‘+ New alert rule’ this window will appear.

To select a resource, click ‘select’. It will display this window where you can select the resource by filtering the subscription, and resource type and the location of the resource. Then select ‘Done’ in the bottom.

Once the resource is selected, now configure the condition. Click ‘select’ to configure the signal. The signal type will show both metrics and activity log for the selected resource.

Select the signal for which you need to create the alert, after selecting the signal, a new consecutive window is displayed, where you need to describe the alert logic.

Set the threshold sensitivity above which you need to trigger the alert. Setting the threshold sensitivity is applicable for static threshold only.

For dynamic threshold, the value is determined by continuously learning the data of the metric series and trying to model it using a set of algorithms and methods. It detects patterns in the data such as seasonality (Hourly / Daily / Weekly) and can handle noisy metrics (such as machine CPU or memory) as well as metrics with low dispersion (such as availability and error rate).

Now select an ‘action group’ if you already have one or create a new action group.

  • Provide a name for the action group.
  • Select the subscription and resource group where the action group needs to be deployed.
  • If you have selected the action type as Email/SMS/Push/Voice, that will display another window to configure the necessary details like email ID, contact number for SMS and voice notifications, etc., provide the information and select OK.
  • You can see the different action types available in the image below.

Input the alert details, alert rule name, description of the alert, and severity of the rule. Select ‘enable rule upon creation’.

Finally click ‘create alert rule’. It might take some time to create the alert and for it to start working.

HOW TO CREATE LOG SEARCH QUERY ALERTS

Repeat steps 1 to 3 as outlined in the Metric alert creation. In step 3 select the resource type as “log analytics workspace”.

Now select the condition, you can choose the “Log (saved query)” or select “Custom log search”.

Select the signal name as per your requirements; a new signal window will be displayed containing the attributes corresponding to the selected signal.

Here we have selected a saved query, which provides the result shown as above.

  1. Rule created based on “Number of results” and the threshold provided
  2. Metric measurement and the threshold provided. The Trigger alert based on,
    • Total breaches or
    • Continuous breaches of the threshold provided in the metric measurement.

Provide the evaluation based on time and the frequency in minutes where the alert rule needs to be monitored.

Follow the steps 8 and 9 as outlined in the Metric alert creation.

STEPS TO CREATE ACTIVITY LOG ALERTS

Repeat steps 1 to 3 as outlined in the Metric alert creation. In step 3 select the resource type as “log analytics workspace”.

On selecting the condition, click ‘Monitor Service’ and select the activity log-Administrative.

Here we have selected, all administrative operations as the signal.

Now configure the alert logic. The event level has many types. Select as per your requirement and click Done in the bottom.

Follow the steps 8 and 9 as outlined in the Metric alert creation.

STEPS TO CREATE A SERVICE HEALTH ALERT

You can receive an alert when Azure sends service health notifications to your Azure subscription. You can configure the alert based on:

  • The class of service health notification (Service issues, Planned maintenance, Health advisories).
  • The subscription affected.
  • The service(s) affected.
  • The region(s) affected.

Login into Azure portal, search for service health if it is on the left side. Click service health.

You can see the service health service is now visible and select the “Health alerts” in the alerts section.

Select Create service health alert and fill in the fields.

Select the subscription and services for which you need to be alerted.

Select the ‘region’ where your resources are located and select the ‘Event type’. Azure provides the following event types,

Select “all the event types” so that you can receive alerts irrespective of the event type.

Follow the steps 8 and 9 as outlined in the Metric alert creation. Then click on ‘Create Alert rule’. The service health alert can be seen in the Health Alerts section.

Automation Testing helps complete the entire software testing life cycle (STLC) in less time and improve efficiency of the testing process.

Test Automation enables teams to verify functionality, test for regression and run simultaneous tests efficiently. In this article we will take a detailed look at the Automation Testing Tools available, standards and best practices to be followed during Test Automation.

Following the best practices for Software Testing Life Cycle (Unit testing, Integration Testing & System Testing) ensures that the client gets the software as intended without any bugs. End-to-end testing is the methodology used to test whether the flow of an application is performing as designed from start to finish. Carrying out end-to-end tests helps identify system dependencies and ensure the flow of right information across various system components and the system.

Ultimately Automation Testing increases the speed of test execution and the test coverage.

When to Choose Automation Testing
  • There is lots of regression work
  • GUI is same, but you have lot of often functional changes
  • Requirements do not change frequently
  • Load and performance testing with many virtual users
  • Repetitive test cases that tend well to automation & saves time
  • Huge projects
  • Projects that need to test the same areas

Steps to Implement Automation Testing
  • Identify areas within software to automate
  • Choose the appropriate tool for test automation
  • Write test scripts
  • Develop test suits
  • Execute test scripts
  • Build result reports
  • Find possible bugs or performance issues
Choosing your Automation Testing Tool

The strategy to adopt test automation should clearly define when to opt for automation, its scope and selection of the right kind of tools for execution. And when it comes to tools the top ones to go for are

  • Cypress
  • Selenium
  • Protractor
  • Appium(Mobile)
Why Cypress?

Cypress is a JavaScript based testing framework built for the modern web. Cypress helps to create End-to-end tests, Integration tests and Unit tests. Cypress takes a different approach compared to other testing frameworks, since it’s executed in the same run loop as the application. It also leverages a Node.js server to handle any task that needs to happen outside of the browser. With its ability to understand everything happening inside and outside of the browser, it produces more consistent results.

Key Features of Cypress
  • Automatic Waiting – No need for adding wait and sleep.
  • Spies, Stubs, and Clocks – Verify and control the behaviour of functions, server responses, or timers.
  • Network traffic control and monitoring – Easily control, stub, and test edge cases without involving your server. You can stub network traffic however you like.
  • Consistent Results – Cypress architecture doesn’t use Selenium or WebDriver. It is fast, consistent and does reliable tests that are flake-free.
  • Screenshots and Videos – View screenshots taken automatically on failure, or videos of your entire test suite when run from the CLI.
Azure CICD Setup with Cypress

Cypress runs on most of the following CI providers.

Azure DevOps / VSTS CI / TeamFoundation
BitBucket
CircleCI
Docker
GitLab
Jenkins
TravisCI

Azure DevOps – Steps to Integrate Cypress Automation Tests
  • Pre-Build Testing
  • Install the Node module and run application in test mode
  • Run the tests
  • Publish the test results
  • Cypress Containerization
  • Build the docker container of cypress
  • Push the image to container
  • Publish the Build

Before we get started here are the basic Cypress installation commands

Clean up the old results
$ rm -rf cypress/reports/
 
Run the cypress application with required spec file.
$ cypress run –spec \”cypress/integration/**/*.spec.ts\” // mention your spec file
 
Configure the mocha reports path for publishing test results.
–reporter junit –reporter-options ‘mochaFile=cypress/reports/test-output-[hash].xml,toConsole=true’
 
Uninstall the application.
$ npm uninstall cypress-multi-reporters; npm uninstall cypress-promise; npm uninstall cypres

Pre-Build Testing

It is critical to test the application before the Build, Deployment or Release. Essentially the process involves regression and smoke testing. And don’t forget the sanity checks before the build is deployed in the staging environment.

Cypress comes in handy for testing angular / JavaScript applications before they are deployed to staging or production environment.

Install the Node module and run application in test mode

Install the required node module of the application then run the application with test mode.

$ npm install –save-dev start-server-and-test

$ start-server-and-test start http://localhost:4200

Publish the test results

The results of the Cypress test execution are stored in specified path and are added to the Azure DevOps test results. Cypress supports JUnit, Mocha, Mochawsome test results reporter formats and provides options to create customised test results and merge all the test results as well.

Cypress Containerization

Cypress supports docker containerization and that makes it easy to set it up in a cluster environment like AKS. The Cypress base images are available at the link below.

https://github.com/cypress-io/cypress-docker-images

Copy the package.json and UI source code to the app folder and run the Cypress test. The following commands are used to run the docker and execute.

  script: |
        docker run -d -it --name cypressName:cypressImageTag bash
        docker commit -p cypressName:cypressImageTag
        docker stop cypressName
        docker rm -f cypressName
    
    - script: docker tag cypressName:cypressImageTag
      displayName: Tag Cypress image 
      
    
    - task: Docker@1
    displayName: Push image To Registry
    inputs:
        command: push
        azureSubscriptionEndpoint: azureSubscriptionEndpoint
        azureContainerRegistry: $(azureContainerRegistry)
        imageName: acrImageName:BuildId
 
    - script: sudo rm -rf /test-results/*
    displayName: Removing Previous Results
 
    - task: ShellScript@2
    displayName: 'Bash Script - cypress base image post-deployment'
    inputs:
        scriptPath: ./cypress-deployment.sh
        args: $(azureRegistry) $(cypressImageName) $(azureContainerValue) $(CYPRESS_OPTIONS) 
        continueOnError: true
    - task: PublishTestResults@1
    displayName: 'Publish Test Results ./test-results-*.xml'
    inputs:
 
    cypress-base-image-post-deployment.sh
 
    docker run -v $systemSourceDirectory:/app/cypress/reports --name vca-arp-ui 
    $cypress_Latestimage npx cypress run $cypressOptions bash

Now the container should be set up on on your local machine and start running your specs.

Cypress is simple and easily integrates with your CI environment. Apart from the browser support, Cypress reduces the efforts of manual testing and is relatively faster when compared to other automation testing tools.

How to Import BACPAC File Created from Azure SQL Database?

When you need to export a database for archiving or for moving to another platform, you can export the database schema and data to a BACPAC file. A BACPAC file is a ZIP file with an extension of BACPAC containing the metadata and data from a SQL Server database. A BACPAC file can be stored in Azure Blob storage or in local storage in an on-premises location and later imported back into Azure SQL Database or into a SQL Server on-premises installation.

Import BACPAC File to On-Premise SQL Server :

  • C:\Program Files (x86)\Microsoft SQL Server\140\DAC\bin>
  • SqlPackage.exe /a:import /sf:\\Userdb0.bacpac /tsn:SERVER-SQL\DEV2016 /tdn:Azure_Test /p:CommandTimeout=2400

Error :

When you are try to import BACPAC File created from Azure Environment, you might encounter the following error if it consists of External Data Source Reference.

TITLE: Microsoft SQL Server Management Studio
            
    Could not import package. 
    Warning SQL72012: The object [AzureProd] exists in the target, 
    but it will not be dropped even though you selected the 
    ‘Generate drop statements for objects that are in the target database but that 
    are not in the source’ check box. 
    Warning SQL72012: The object [AzureProd_Log] exists in the target,
    but it will not be dropped even though you selected the 
    ‘Generate drop statements for objects that are in the target database but that 
    are not in the source’ check box. 
    Error SQL72014: .Net SqlClient Data Provider: Msg 102, Level 15, State 1, 
    Line 1 Incorrect syntax near ‘EXTERNAL’. 
    Error SQL72045: Script execution error. The executed script: 
    CREATE EXTERNAL DATA SOURCE [DB_EXT_EDS]
    WITH (
    TYPE = RDBMS,
    LOCATION = N’sqlserver.database.windows.net’,
    DATABASE_NAME = N’AdventureWorks’, 
    CREDENTIAL = [DB_EXT_CRED] ); 


Solution :

Drop external Tables and External Data Source in Azure SQL Database and create BACPAC File again without those references.

Drop External Tables and External Data Source

            
        IF EXISTS 
        (
        SELECT 'x' FROM sys.external_tables)
        BEGIN
        DROP EXTERNAL TABLE EXT_Table1 
        DROP EXTERNAL TABLE EXT_Table2 
        DROP EXTERNAL TABLE EXT_Table3 
        END   
         
        IF EXISTS 
        ( 
        SELECT * FROM sys.external_data_sources 
        WHERE name ='DB_EXT_EDS' 
        ) 
        BEGIN 
        DROP EXTERNAL DATA SOURCE DB_EXT_EDS; 
        END  


If you can’t recreate BACPAC without dropping the tables, you can follow these steps.

  1. Change the file extension to zip, then decompress it into a folder. Surprisingly, a bacpac is actually just a zip file, not something proprietary and hard to get into.
  2. Find the model.xml file and edit it to remove the section that looks like this:
<Element Type=”SqlExternalDataSource” Name=”[BoxDataSrc]”>
<Property Name=”DataSourceType” Value=”1′′ />
<Property Name=”Location” Value=”MYAZUREServer.database.windows.net” /> 
<Property Name=”DatabaseName” Value=”MyAzureDb” />
<Relationship Name=”Credential”>
<Entry>
<References Name=”[SQL_Credential]” />
</Entry>
</Relationship>
</Element>

If you have multiple external data sources of this type, you will probably need to repeat step 2 for each one.

Save and close model.xml.

Now you need to re-generate the checksum for model.xml so that the bacpac doesn’t think it was tampered with (since you just tampered with it). Create a PowerShell file named computeHash.ps1 and put this code into it.

Generate Checksum

             
            $modelXmlPath = Read-Host "model.xml file path" 
            $hasher = [System.Security.Cryptography.HashAlgorithm]:
            :Create("System.Security.Cryptography.SHA256Crypt oServiceProvider") 
            $fileStream = new-object System.IO.FileStream ` -ArgumentList
            @($modelXmlPath, [System.IO.FileMode]::Open) 
            $hash = $hasher.ComputeHash($fileStream) 
            $hashString = "" Foreach ($b in $hash) { $hashString += $b.ToString("X2") } 
            $fileStream.Close() $hashString 


Run the PowerShell script and give it the filepath to your unzipped and edited model.xml file. It will return a checksum value.

Copy the checksum value, then open up Origin.xml and replace the existing checksum, toward the bottom on the line that looks like this:

<Checksum Uri=”/model.xml”>9EA0F06B282G4F42955C78A98822A31AA0ED0225CB131B
8759379055A482D0 1G</Checksum> 

Save and close Origin.xml, then select all the files and put them into a new zip file and rename the extension to bacpac.

Now you can use this new bacpac to import the database without getting the error.

Deadlocks in Azure SQL Database

Recently we were working with Azure Logic Apps to invoke Azure Functions.
By Default, Logic App runs parallel threads and we didn’t explicitly control the concurrency and left the default values.

So Logic App invoked several concurrent threads which in turn invoked several Azure Functions.
The problem was Azure Functions invoked Database Calls which caused Deadlocks. In Ideal world, Database should be able to handle numerous concurrent functions without deadlocks. Our process high percentage of shared data and we wanted to ensure the consistency , so we had Explicit Transactions in our Stored procedure calls. That’s the root cause of the problem and we didn’t want to remove the explicit Transaction.

The solution we implemented to alleviate this problem is to run this process in Sequence instead of parallel threads.

Log App Concurrency Control Behavior

For each loops execute in parallel by default. Customize the degree of parallelism, or set it to 1 to execute in sequence.

Logic_App_Concurrency

Deadlock Exception

Transaction (Process ID 166) was deadlocked on lock
| communication buffer resources with another process and has been chosen as the deadlock victim. Rerun the transaction.

Deadlock_Exception

Troubleshooting Deadlocks

So we have identified Deadlock happened in the database through our Application Insights. Next logical question is , what caused this deadlock.

Azure SQL Server Deadlock Count

These queries identifies the deadlock event time as well as the deadlock event details.

                
        SELECT * FROM sys.event_log   
        WHERE event_type = 'deadlock';
        WITH CTE AS (  
        SELECT CAST(event_data AS XML)  AS [target_data_XML]   
        FROM sys.fn_xe_telemetry_blob_target_read_file('dl', 
        null, null, null)  
        )  
        SELECT target_data_XML.value('(/event/@timestamp)[1]', 
        'DateTime2') AS Timestamp,  
        target_data_XML.query('/event/data[@name=''xml_report'']
        /value/deadlock') AS deadlock_xml,  
        target_data_XML.query('/event/data[@name=''database_name'']
        /value').value('(/value)[1]', 'nvarchar(100)') AS db_name  
        FROM CTE


You can save the Deadlock xml as xdl to view the Deadlock Diagram. This provides all the information we need to identify the root cause of the deadlock and take necessary steps to resolve the issue.

References

Grafana is an open-source, general purpose dashboard and graph composer, which runs as a web application.

You can monitor Azure services and applications from Grafana using the Azure Monitor data source plugin. The plugin gathers application performance data collected by the Application Insights SDK as well as infrastructure data provided by Azure Monitor. You can then display this data on your Grafana dashboard.

Grafana uses an Azure Active Directory service principal to connect to Azure Monitor APIs and collect metrics data. You must create a service principal to manage access to your Azure resources.

Why Grafana?

Grafana provides more visualization options than the Azure Portal. It also supports multiple data sources. One can combine data from multiple sources in a single dashboard. Grafana is designed for analyzing and visualizing metrics such as system CPU, memory, disk and I/O utilization. Users can create comprehensive charts with smart axis formats (such as lines and points) as a result of Grafana’s fast, client-side rendering — even over long ranges of time.

Grafana dashboards are what made Grafana such a popular visualization tool. Visualizations in Grafana are called panels, and users can create a dashboard containing panels for different data sources. Grafana supports graph, singlestat, table, heatmap and freetext panel types. Grafana users can make use of a large ecosystem of ready-made dashboards for different data types and sources. Grafana has no time series storage support. Grafana is only a visualization solution. Time series storage is not part of its core functionality.

Some of the features of Grafana are as follows

  • Optimized for Time series
  • Can pull data from Azure Metrics, Log Analytics and Application Insights
  • Azure Data Explorer (formerly known as Kusto) plugin also released.
  • Rich ecosystem of plugins for data sources and dashboards.
  • Open Source, easy to onboard using Docker, Azure App Service etc.
Azure-app-service

Some of the requirements of Grafana are described below.

  • Azure SPN (Service Principal Name) with reader access to subscription
  • Deploy in Azure web apps.
  • Data source plugin “grafana-azure-monitor-datasource”
  • Supports AD integration via LDAP
  • Easy to export/import and templatize
  • Very DevOps friendly
  • Huge collection of panels https://play.grafana.org
Grafana

Azure Monitor Data Source For Grafana

Azure Monitor is the platform service that provides a single source for monitoring Azure resources. The Azure Monitor Data Source plugin supports Azure Monitor, Azure Log Analytics and Application Insights metrics in Grafana.

Features

  • Support for all the Azure Monitor metrics
    • includes support for the latest API version that allows multi-dimensional filtering for the Storage and SQL metrics.
    • Automatic time grain mode which will group the metrics by the most appropriate time grain value
  • Application Insights metrics
    • Write raw log analytics queries, and select x-axis, y-axis, and grouped values manually.
    • Automatic time grain support
  • Support for Log Analytics (both for Azure Monitor and Application Insights)
  • You can combine metrics from both services in the same graph.
Grafana-graph

Azure Monitor for VMs provides an in-depth view of VM health, performance trends, and dependencies. Azure Monitor for VMs includes a set of performance charts that target several key performance indicators (KPIs) to help you determine how well a virtual machine is performing. Azure Monitor for VMs is focused on the operating system as manifested through the processor, memory, network adapters, and disks.

Azure Dashboards

Azure dashboards allow you to combine different kinds of data, including both metrics and logs, into a single pane in the Azure portal. You can optionally share the dashboard with other Azure users. Elements throughout Azure Monitor can be added to an Azure dashboard in addition to the output of any log query or metrics chart. Azure Monitor is single source for monitoring azure resources. Its Azure’s time series database for all azure metrics.

Some of the important aspects of Azure Dashboard

  • No setup required, already available within Azure Portal.
  • Zoom in zoom out for metrics not available
  • All data from Azure resources.
  • Log Analytics/AI queries cannot be parameterized based on Dashboard selection.
  • Query results can be pinned to dashboards
  • Good panels are not tied to products and can’t be customized.
    • Eg. percentile panels is only available in “Container Insights” and VM insights.
    • The panel cannot be used against “Log Analytics” source or Metric source.

Some of the features of Azure Dashboard are as follows

  • Supports visualizing most Azure resources
  • OOB Integrated with Azure RBAC
  • Supports Log Analytics, App Insights and Metrics
  • No Auto refresh per panel
  • No Zoom in Zoom out.
  • Dashboard queries don’t support variables

Azure Dashboards (VM insights/ Container Insights)

  • These tiles can only be accessed by navigating to the VM resource.
  • They cannot be pinned as is, but the detailed version of this can be pinned.
  • No zoom in zoom out capability.

Azure Dashboards – Metrics

  • These are pinnable
  • Don’t support percentiles
  • No drill ability
  • Each Panel is hard coded to a specific data source even if they might be the same behind the scenes.

Comparison between Grafana and Azure Dashboard is shown below.

Azure Dashboard
  • Multiple Azure resource types
  • Limited configuration options. Requires JSON editing
  • Application Insights à OOB Azure Dashboard
  • Only static queries
  • No setup required
  • Not intuitive for overlaying.
Grafana
  • Mostly Time Series
  • Highly configurable
  • Global variables as filters
  • Dashbord and individual panel refresh.
  • Supports query macros
  • Setup required (minimal)
  • Intuitive overlays

We are evaluating pros and cons of different hosting solutions for SQL Server which best suits our business needs.

Our business needs

Our demand is very predictable seasonal demand. We are very small and can’t afford dedicated team for managing database infrastructure.( No DBA Team) Sky high expectation from Customers on availability and reliability for about 2 months in a year. Few minutes of downtown during peak period can cause havoc to our business . Fixed budget with very little wiggle room.   Our plan is to evaluate AWS SQL Server RDS, Azure RDS , Managed solutions from hosting provider. Evaluate each option in these categories.

  1. Performance and Reliability
  2. Ability to scale up during peak loads
  3. Cost ( Based on Network , Storage, Memory and CPU )
  4. Operations Efficiency
  5. Compliance
Infrastructure Requirements :

SQL Server Enterprise Edition since we use enterprise features AlwaysOn Availability group for High Availability Geo Replication or Multi Availability zone implementation for Cloud based databases Ability to route Read/Write workloads 128 Gig RAM – Minimum 1 – 2 TB Storage with 500 Gigs of SSD for TempDB Database and High Volume Tables Memory Optimized OLTP Support which needs SQL Server 2016 Edition Ability to handle ~ 30 K IOPS during peak load.

Amazon AWS SQL Server RDS

RDS Pricing Link  AWS SQL Server RDS Pricing http://www.ec2instances.info/rds/?selected=db.r3.8xlarge

Enterprise Edition  Single-AZ Deployment
 Price Per Hour
Memory Optimized Instances – Current Generation
db.r3.2xlarge$5.810
db.r3.4xlarge$11.404
db.r3.8xlarge$19.271


Multi-AZ Deployment
 Price Per Hour
Memory Optimized Instances – Current Generation
db.r3.2xlarge$11.620
db.r3.4xlarge$22.808
db.r3.8xlarge$38.542

AWS SQL Server RDS Configurations On-Demand for SQL Server (License Included) Multi-AZ Deployment Region:  US East (N. Virginia) Memory Optimized Instances – Current Generation Price Per Hour RAM : 244 GB 10 Gigabit 32 vCPU 20,000 Provisioned IOPS  

db.r3.8xlarge244 GB2 x 320 SSDIntel Xeon E5-2670 v2 (Ivy Bridge)32 vCPUs10 Gigabit

https://aws.amazon.com/rds/sqlserver/pricing/
Azure Pricing Calculator

Azure performance is measured in DTU. We have been collecting our performance metrics during load test. The following link provides lightweight utility to convert perfmon counters to Azure DTU’s.

Perfmon to Azure DTU calculator

Understanding DTUs Based on Microsoft definition :https://azure.microsoft.com/en-us/documentation/articles/sql-database-service-tiers/  

The Database Transaction Unit (DTU) is the unit of measure in SQL Database that represents the relative power of databases based on a real-world measure: the database transaction. We took a set of operations that are typical for an online transaction processing (OLTP) request, and then measured how many transactions could be completed per second under fully loaded.

 : Azure RDS Pricing Calculator
Azure SQL Server Pricing Calculator
Azure Options for SQL Server
https://azure.microsoft.com/en-us/pricing/details/sql-database/
Basic
eDTUs PER POOLMAX STORAGE PER POOL 1MAX DBs PER POOLMAX eDTUs PER DATABASEPRICE 2
10010 GB2005~$149/mo
20020 GB4005~$298/mo
40039 GB4005~$595/mo
80078 GB4005~$1,198/mo
1200117 GB4005~$1,800/mo
Standard
eDTUs PER POOLMAX STORAGE PER POOL 1MAX DBs PER POOLMAX eDTUs PER DATABASEPRICE 2
100100 GB200100~$223/mo
200200 GB400100~$446/mo
400400 GB400100~$900/mo
800800 GB400100~$1,800/mo
12001.2 TB400100~$2,701/mo
Premium
eDTUs PER POOLMAX STORAGE PER POOL 1MAX DBs PER POOLMAX eDTUs PER DATABASEPRICE 2
125250 GB50125~$697/mo
250500 GB50250~$1,399/mo
500750 GB50500~$2,790/mo
1000750 GB501000~$5,580/mo
1500750 GB501000~$8,370/mo

1. Security and Compliance:

If you are wondering why we are starting with security, then check out this number. $6 trillion, that’s the amount of annual damage cyber crimes is predicted to cost us by 2021.

Which is precisely why the first thing you need to check while picking your cloud service provider is their security and compliance levels – both physical as well as virtual – this includes the geographical location of their data centers and the local laws of the country they are based in.

There are a number of certifications and standards which guarantee the security preparedness of cloud vendors; their validity must be checked and additional investigations must be carried out by checking internal and third-party audits or reports.

You need to do a deep check of:

  • Security infrastructure and procedures followed by the vendor
  • Identity management and authorizations
  • Physical security controls including the process for natural disasters
  • Policies for data back-up and disaster recovery

2. Technical Capabilities

An obvious point, but it still needs to be reiterated.

Your service provider should have a full stack of technologies that support your current applications and also has the capability to match your future needs.

Cloud partnerships last a long time, and it’s important to check the future roadmap of the service provider to understand if they have the mindset to catch trends early and innovate.

Some questions to focus on:

  • Will your current software and applications integrate easily with the service provider’s cloud infrastructure?
  • Do they use standard interfaces and APIs for easy integration?
  • Do they have the capability of providing hybrid cloud computing options and do they have the flexibility to host different cloud environments and systems?
  • Are they backing their capabilities with SLAs?
  • Are they willing and capable to architect solutions tailored to your business?

3. Costs

No two cloud service providers have similar or comparable pricing packages. They each have their own formula of computing cloud costs, and it is almost impossible to make a side-by-side comparison of different vendors. What you need to do is map out your organization’s requirement as minutely as possible and then decide which pricing model suits your needs.

Keep in mind:

  • Consumption timelines as long-term contracts are better priced
  • The flexibility offered by service providers in scaling up or down
  • Check for hidden costs

4. Business Health

The stability of your business depends on the stability of its partners, and you cannot underestimate the importance of a cloud partner. Before finalizing your cloud vendor, it is important to check their business and financial health.

You should check:

  • The company’s financial records
  • Management structure and other third-party relationships
  • Reputation, reviews, and referrals from existing customers
  • For any legal run-ins
  • All available third-party audits

5. Support

Do you just have a phone or chat access or does your service provider offers dedicated account management? How much support you can get from your vendor is another important criteria, that must be considered before finalizing a service provider.

Find out about:

  • Time guarantees for solving technical issues
  • Access to support services – 24×7 or 12×5
  • Cost of opting for dedicated resources

Deciding on a cloud service provider is a long process that demands complete thoroughness and analysis from the CIO and the rest of the team.

Before we leave you to navigate your way to your future cloud partner, here are two more important points that must be considered – Right size and exit strategy.

Keep in mind that to get the best service you need to find a vendor who connects with you and for whom you are a valuable client.

And always plan an exit strategy in case things don’t work out.

Best of Luck!

When you are deploying a new change into production, the associated deployment should be in a predictable manner. In simple terms, this means no disruption and zero downtime! In case you do encounter a problem or a bottleneck, the deployment strategy should include a quick roll back.

The safe strategy can be achieved by working with two identical infrastructures – the “green” environment hosting the current production and the “blue” environment with the new changes.

The business and IT teams will have an opportunity to conduct sanity, smoke test or any other test in the “blue” environment before making a “Go” decision. Upon “Go”, the team can switch “blue” to “green” and “green” to “blue”.

In Azure, different processes are available for implementing the Blue-Green strategy with two environments.

We have listed below some of these techniques. Naturally, this list is not fixed and will grow continuously as new tool sets and services emerge.

  • Deployment slots – For Web Apps, deployment slots provide an easy way to implement Blue-Green deployments.
  • Azure Traffic Manager – This can be leveraged to realize Blue-Green deployments for smoother deployments with weighted round-robin routing method. The detailed configuration and implementation methods are available in Azure Documentation.
  • Using an Application Gateway with two backend pools and a routing rule – Have two backend resource pools with one as a stage pool and another one as a prod pool. Add stage VMSS to stage pool, prod VMSS to prod pool and have one routing rule in the app gateway. Depending on the need to use stage or prod VMSS, this rule will be changed to point to the appropriate backend address pool.

CloudIQ architects and engineers have implemented Blue-Green deployment for multiple clients, and in each case, we have customized our strategies to suit their use-cases. If you are looking for a completely safe way to deploy new software versions and applications, then reach out to us at [email protected]

Apache Spark is an open-source parallel processing framework for running large-scale data analytics applications across clustered computers. It can handle both batch and real-time analytics and data processing workloads.

Spark provides distributed task transmission, scheduling, and I/O functionality. It provides programmers with a potentially faster and more flexible alternative to MapReduce, the software framework to which early versions of Hadoop were tied.

How Apache Spark works

Apache Spark can process data from a variety of data repositories, including the Hadoop Distributed File System (HDFS), NoSQL databases and relational data stores.

The Spark Core engine uses the resilient distributed data set, or RDD, as its primary data type. The RDD is designed in such a way to hide much of the computational complexity from users. It aggregates data and partitions it across a server cluster, where it can then be computed and either moved to a different data store or run through an analytic model. The user doesn’t have to define where specific files are sent or what computational resources are used to store or retrieve files.

Given below is a sample Spark program written in Python to count the number of records with each rating in the input file given in next page:

 from pyspark import SparkConf, SparkContext
        import collections
        
        conf = SparkConf().setMaster("local").setAppName("RatingsHistogram")
        sc = SparkContext(conf = conf)
        
        lines = sc.textFile("file:///SparkCourse/ml-100k/u.data")
        ratings = lines.map(lambda x: x.split()[2])
        result = ratings.countByValue()
        
        sortedResults = collections.OrderedDict(sorted(result.items()))
        for key, value in sortedResults.items():
            print("%s %i" % (key, value))


In the above code, sc is the SparkContext associated with input file u.data. ratings is a RDD created by mapping the 3rd column in input file (array occurrence [2] – Ratings). Here map() is a transformation function which produces a new RDD.

We can have multiple transformations in a single spark program each producing a new RDD from an existing RDD or an input file. countByValue() is an Action that is performed.
In Spark, the transformations are not executed until an Action is triggered. This is called Lazy Evaluation.

Apache Spark works

Figure 1

Spark languages

Spark was written in Scala, which is considered the primary language for interacting with the Spark Core engine. Out of the box, Spark also comes with API connectors for using Java, R, and Python.

Spark libraries

  • The Spark Core engine functions partly as an application programming interface (API) layer and underpins a set of related tools for managing and analyzing data.
  • Spark SQL — One of the most commonly used libraries, Spark SQL enables users to query data stored in disparate applications using the common SQL language.
  • Spark Streaming — This library allows users to build applications that analyze and present data in real time.
  • MLlib — A library of machine learning code that enables users to apply advanced statistical operations to data in their Spark cluster and to build applications around these analyses.
  • GraphX — A built-in library of algorithms for graph-parallel computation.

RDDs, DataFrames, and Datasets

An RDD is an immutable distributed collection of elements of data, partitioned across nodes in a cluster that can be operated in parallel with a low-level API that offers transformations and actions.

Like an RDD, a DataFrame is an immutable distributed collection of data. However, unlike an RDD, data is organized into named columns, like a table in a relational database.

Datasets in Apache Spark are an extension of DataFrame API which provides type-safe, object-oriented programming interface.

Executing SQL-style functions on a Dataframe

Given below is a map-reduce program to get the list of popular movies (which has been rated by many customers using the same input data as Figure 1 above).

 from pyspark import SparkConf, SparkContext
        
        conf = SparkConf().setMaster("local").setAppName("PopularMovies")
        sc = SparkContext(conf = conf)
        
        lines = sc.textFile("file:///SparkCourse/ml-100k/u.data")
        movies = lines.map(lambda x: (int(x.split()[1]), 1))
        movieCounts = movies.reduceByKey(lambda x, y: x + y)
        
        flipped = movieCounts.map( lambda xy: (xy[1],xy[0]) )
        sortedMovies = flipped.sortByKey()
        
        results = sortedMovies.collect()
        
        for result in results:
            print(result)


The same program, when written using DataFrames, will look like this

 from pyspark.sql import SparkSession
        from pyspark.sql import Row
        from pyspark.sql import functions
        
        def loadMovieNames():
            movieNames = {}
            with open("ml-100k/u.ITEM") as f:
                for line in f:
                    fields = line.split('|')
                    movieNames[int(fields[0])] = fields[1]
            return movieNames
        
        # Create a SparkSession (the config bit is only for Windows!)
        spark = SparkSession.builder.config("spark.sql.warehouse.dir", 
        "file:///C:/temp").appName("PopularMovies").getOrCreate()
        # Load up our movie ID -> name dictionary
        nameDict = loadMovieNames()
        
        # Get the raw data
        lines = spark.sparkContext.textFile("file:///SparkCourse/ml-100k/u.data")
        # Convert it to a RDD of Row objects
        movies = lines.map(lambda x: Row(movieID =int(x.split()[1])))
        # Convert that to a DataFrame
        movieDataset = spark.createDataFrame(movies)
        
        # Some SQL-Style magic to sort all movies by popularity in one line!
        topMovieIDs = movieDataset.groupBy("movieID").count().orderBy
        ("count", ascending=False).cache()
        
        # Show the results at this point:
        
        #|movieID|count|
        #+-------+-----+
        #|     50|  584|
        #|    258|  509|
        #|    100|  508|
        
        topMovieIDs.show()
        
        # Grab the top 10
        top10 = topMovieIDs.take(10)
        
        # Print the results
        print("\n")
        for result in top10:
            # Each row has movieID, count as above.
            print("%s: %d" % (nameDict[result[0]], result[1]))
        
        # Stop the session
        spark.stop()


As you can see DataFrames gives us the flexibility to use SQL style functions to get the required results. Because DataFrames APIs are built on top of the Spark SQL engine, it uses Catalyst to generate an optimized logical and physical query plan.

Job Scheduling

Spark has several facilities for scheduling resources between computations.

  • Each Spark application (instance of SparkContext) runs an independent set of executor processes. The cluster managers that Spark runs on provide facilities for scheduling across applications.
  • Within each Spark application, multiple “jobs” (Spark actions) may be running concurrently if they were submitted by different threads. This is common if the application is serving requests over the network. Spark includes a fair scheduler to schedule resources within each SparkContext.

Spark Streaming

Spark Streaming is an extension of the core Spark API that enables scalable, high-throughput, fault-tolerant stream processing of live data streams. Data can be ingested from many sources like Kafka, Flume, Kinesis, or TCP sockets, and can be processed using complex algorithms expressed with high-level functions like map, reduce, join and window. Finally, processed data can be pushed out to filesystems, databases, and live dashboards.

Spark Streaming

The Python program shown below counts the number of words in text data received from a data server listening on a TCP socket.

Sample input entered for this program at a terminal through NetCat and the output of the program is given below.


# TERMINAL 1:
# Running Netcat

$ nc -lk 9999

hello world
...


# TERMINAL 2: RUNNING network_wordcount.py
        
$ ./bin/spark-submit examples/src/main/python/streaming/network_wordcount.py 
localhost 9999
...
-------------------------------------------
Time: 2014-10-14 15:25:21
-------------------------------------------
(hello,1)
(world,1)
...


Conclusion

Launched for the first time in May 2014, Apache Spark has become the go-to program for companies that work with large-scale Big Data applications. The speed and agility of Spark have made it incredibly useful across a wide range of industries.

From FMCG giants to BFSI companies to digital advertising firms – Apache Spark has proved to be indispensable when it comes to aggregating data, gleaning insights and forecasting industry trends.

This is the fifth blog in our series helping you understand all about cloud, when you are in a dilemma to choose Azure or AWS or both, if needed.

Before we jumpstart on the actual comparison chart of Azure and AWS, we would like to bring you some basics on data analytics and the current trends on the subject.

If you would rather like to have quick look at the comparison table, Click here

This blog is intended to help you strategize your data analytics initiatives so that you can make the most informed decision possible by analyzing all the data you need in real time. Furthermore, we also will help you draw comparisons between Azure and AWS, the two leaders in cloud, and their capabilities in Big Data and Analytics as published in a handout released by Microsoft.

Beyond doubts, this is an era of data. Every touch point of your business generates volumes of data and these data cannot be simply whisked away, cast aside as valuable business insights can be unearthed with a little effort. Here’s where your Data Analytics infrastructure helps.

A 2017 Planning Guide for Data and Analytics published by Gartner written by the Analyst John Hagerty states that

The Key Findings as per the report are as follows:

  • Data and analytics must drive modern business operations, not just reflect them. Technical professionals must holistically manage an end-to-end data and analytics architecture to acquire, organize, analyze and deliver insights to support that goal.
  • Analytics are now infused in places where they never existed before.
  • Executives will seek strategies to better manage and monetize data for internal and external business ecosystems.
  • Data gravity is rapidly shifting to the cloud, with IoT, data providers and cloud-native applications leading the way. It is no longer a question of “if” for using cloud for data and analytics; it’s “how.”

The last point emphasizes on how cloud is playing a prominent role when it comes to Data Analytics and if you have thoughts on who and how, Gartner in its latest magic quadrant has said that AWS and Azure are the top leaders. Now, if you are in doubt whether to go the Azure way or AWS or should it be the both, here’s the comparison table showing their respective Big Data and Analytics Capabilities


ServiceDescriptionAWSAzure
Elastic data warehouseA fully managed data warehouse that analyzes data using business intelligence tools.RedshiftSQL Data Warehouse
Big data processingSupports technologies that break up large data processing tasks into multiple jobs, and then combine the results to enable massive parallelism.Elastic MapReduce (EMR)HDInsight
Data orchestrationProcesses and moves data between different compute and storage services, as well as on-premises data sources at specifed intervals.Data PipelineData Factory
Cloud-based ETL/data integration service that orchestrates and automates the movement and transformation of data from various sources.AWS Glue Data CatalogData Factory + Data Catalog
AnalyticsStorage and analysis platforms that create insights from massive quantities of data, or data that originates from many sources.Kinesis AnalyticsStream Analytics

Data Lake Analytics

Data Lake Store
Streaming dataAllow mass ingestion of small data inputs, typically from devices and sensors, to process and route data.Kinesis Streams

Kinesis Firehose
Event Hubs

Event Hubs Capture
Visualizationperform ad-hoc analysis, and develop business insights from data.QuickSight (Preview)Power BI
Allows visualization and data analysis tools to be embedded in applications.Power BI Embedded
SearchA scalable search server based on Apache Lucene.Elasticsearch ServiceMarketplace—Elasticsearch
Delivers full-text search and related search analytics and capabilities.CloudSearchSearch
Machine learningProduces an end-to-end workfow to create, process, refne, and publish predictive models from complex data sets.Machine LearningMachine Learning
Data discoveryProvides the ability to better register, enrich, discover, understand, and consume data sources.Data Catalog
A serverless interactive query service that uses standard SQL for analyzing databases.Amazon AthenaData Lake Analytics

Click here to read the entire guide published by Microsoft Azure Team:

This is our fourth blog in the series of blogs intended to help you embark on a cloud strategy, most importantly when you are in dilemma to choose AWS or Azure, the two prominent cloud players today.

If you had missed our earlier blogs, click here

1st Blog – Compute

2nd Blog- Storage

3rd Blog- CDN & Networking

Before we jumpstart on the actual comparison chart of Azure and AWS, we would like to bring you some basics on the database aspect of cloud strategy.

If you would rather like to have quick look at the database comparison table, click here

Through this blog, let’s understand the database aspect of your cloud strategy. As per the guide, Database services refers to options for storing data, whether it’s a managed relational SQL database that’s globally distributed or a multi-model NoSQL database designed for any scale.

When you decide cloud, one of the critical decisions you face is which database to use – SQL or NoSQL. Though SQL has an impressive track record, NoSQL is not far behind as it is gradually making notable gains and has many proponents. Once you have picked your database, the other big decision to make is which cloud vendor to choose amongst the many vendors.

Here’s where you consider Gartner’s prediction; the research company published a document that states

“Public cloud services, such as Amazon Web Services (AWS), Microsoft Azure and IBM Cloud, are innovation juggernauts that offer highly operating-cost-competitive alternatives to traditional, on-premises hosting environments.

Cloud databases are now essential for emerging digital business use cases, next-generation applications and initiatives such as IoT. Gartner recommends that enterprises make cloud databases the preferred deployment model for all new business processes, workloads, and applications. As such, architects and tech professionals should start building a cloud-first data strategy now, if they haven’t done so already”

Reinstating the trend, recently Gartner has published a new magic quadrant for infrastructure-as-a-service (IaaS) that – surprising nobody – has Amazon Web Services and Microsoft alone in the leader’s quadrant and a few others thought outside of the box.


Now, the question really is, Azure or AWS for your cloud data? Or should it be both? Here’s a quick comparison table to guide you.

ServiceDescriptionAWSAzure
Relational databaseSQL Database is a high-performance, reliable, and secure database you can use to build data-driven applications and websites, without needing to manage infrastructure.RDSSQL Database including Postgres and MySQL
NoSQL—document storageA globally-distributed, multi-model database that natively supports multiple data models: key-value, documents, graphs, and columnar.DynamoDBCosmos DB
NoSQL—key/value storageA non-relational data store for semi-structured data.DynamoDB and SimpleDBTable Storage
CachingAn in-memory–based, distributed-caching service that provides a high-performance store typically used to offoad non-transactional work from a database.ElastiCacheRedis Cache
Database migrationFocuses on migration of database schema and data from one database format to a specifc database technology in the cloud.Database Migration Service (Preview)SQL Database Migration Wizard

Click here to read the entire guide published by Microsoft Azure Team:

In line with our latest blog series highlighting how common cloud services are made available via Azure and Amazon Web Services (AWS), as published by Microsoft, this third blog in the series helps you understand Cloud Networking and Content Delivery capabilities of both Azure and AWS.

Before we jumpstart on the actual comparison chart of Azure and AWS, we would like to bring you some basics on cloud content delivery networking and the current trends on the subject.

If you would rather like to have quick look at the comparison table, click here

When we talk about cloud Content Delivery Network (CDN) and the related networking capabilities it includes all the hardware and software that allows you to easily provision private networks, connect your cloud application to your on-premises datacenters, and more.

According to Gartner, Content delivery networks (CDNs) are a type of distributed computing infrastructure, where devices (servers or appliances) reside in multiple points of presence on multi-hop packet-routing networks, such as the Internet, or on private WANs. A CDN can be used to distribute rich media downloads or streams, deliver software packages and updates, and provide services such as global load balancing, Secure Sockets Layer acceleration and dynamic application acceleration via WAN optimization techniques.

In simpler terms, this highly distributed server platforms are optimized to deliver content in a way that improves customer experience. Hence, it is important to decrease latency by keeping the data closer to the users, protect it from security threats while ensuring rapid streamlined content delivery including general web delivery, content purge, content caching and tracking history as long as 90 days.

As per G2Crowd.com, most organizations use CDN services, such as web caching, request routing, and server-load balancing, to reduce load times and improve website performance. Further to qualify as a CDN provider, a service provider must:

  • Allow access to a geographically dispersed network of PoPs in multiple data centers
  • Help websites access this network to deliver content to website visitors
  • Offer services designed to improve website performance
  • Provide scalable Internet bandwidth allowances according to customer needs
  • Maintain data center(s) of servers to reduce the possibility of overloading individual instances

With this background, let’s look at the AWS vs Azure comparison chart in terms of Networking and Content Delivery Capabilities:

ServiceDescriptionAWSAzure
Cloud virtual networkingProvides an isolated, private environment in the cloud.Virtual Private CloudVirtual Network
Cross-premises connectivityConnects Azure virtual networks to other Azure virtual networks or customer on-premises networks. It also supports VPN tunneling.AWS VPN GatewayVPN Gateway
Domain name system managementManage DNS records using the same credentials, billing, and support contract as other Azure services.

Service that hosts domain names, routes users to Internet applications, manages traf c to apps, and improves app availability with automatic failover.

Route 53

Route 53

DNS

Traffic Manager

Content delivery networkGlobal content delivery network that transfers audio, video, applications, images, and other les.CloudFrontContent Delivery Network
Dedicated networkEstablishes a dedicated, private network connection from a location to the cloud provider.Direct ConnectExpressRoute
Load balancingAutomatically distributes incoming application traf c to add scale, handle failover, and route to a collection of resources.Elastic Load BalancingLoad Balancer

Application Gateway

To read more about the Microsoft guide which briefs all about cloud by drawing comparisons between Azure or AWS, click here (link to PDF download)

You may also like to read our previous blogs in these series, if so, please click here:

https://www.cloudiqtech.com/azure-vs-aws-compute/
https://www.cloudiqtech.com/aws-vs-azure-cloud-storage/

Azure or AWS or Azure & AWS? What’s your cloud strategy for Storage?

This is our second blog, in our latest blog series helping you understand all about cloud, especially when you are in doubt whether to go Azure or AWS or both.

To read our first blog talking about Cloud strategy in general and Compute in particular, click here…

Moving on, in this blog let’s find what Azure or AWS offer when it comes to Storage Capabilities for your Cloud Infrastructure.

Globally CIOs are increasingly looking to cease running their own data centers and move to cloud which is evident when we read the projection made by a leading researcher, MarketsandMarkets. They had reported that the global cloud storage business sector to grow from $18.87 billion in 2015 to $65.41 billion by 2020, at a compound annual growth rate (CAGR) of 28.2 percent during the forecast period.

Reinstating the fact, 451 Research’s Voice of the Enterprise survey last year stated that Public cloud storage spending will double by next year (2017). “IT managers are recognizing the need for storage transformation to meet the realities of the new digital economy, especially in terms of improved efficiency and agility in the face of relentless data growth,” said Simon Robinson, research vice president at 451 and research director of the new Voice of the Enterprise: Storage service. “It’s clear from our Q4 study that emerging options, especially public cloud storage and all-flash array technologies, will be increasingly important components in this transformation” he added further.

As we see, many companies are in for Cloud Storage, undoubtedly. But the big question – Whom to choose from a gamut of leading public cloud players including big players like AZURE, AWS; Should it be AZURE alone for your cloud storage or AWS or a combination of both still prevails.

This needs a thorough understanding. To help you decide for good, we have decided to re-produce a guide, published by Microsoft that briefs Azure‘s capabilities in comparison to AWS when it comes to Cloud Strategy. And we will see the Storage part in this blog, but before, that a little backgrounder on Cloud Storage.

When we talk about cloud storage device mechanisms, we include all logical units of data storage covering from files, blocks, and datasets to objects and their relative storage interfaces. These instances of virtual storage devices are designed specifically for cloud-based provisioning and can be scaled as per need. It is to be noted that different cloud service consumers utilize different technologies to interface with virtualized cloud storage devices.

ServiceDescriptionAWSAzure
Object storageObject storage service for use cases including cloud apps,
content distribution, backup, archiving, disaster recovery,
and big data analytics.
Simple Storage Services (S3) Storage—Block Blob (for content logs, files) (Standard—Hot)
Virtual Server disk
infrastructure
SSD storage optimized for I/O intensive
read/write operations.
Elastic Block Store (EBS)Disk Storage—Page Blobs (for VHDs or other random-write type data)

Disk Storage—Premium Storage

Shared file storageA simple interface to create and configure file
systems quickly as well as share common files.
Elastic File SystemFile Storage (file share between VMs)
Archiving—cool storageA lower cost tier for storing data that is
infrequently accessed and long-lived.
S3 IA GlacierStorage—Hot, Cool & Archive Tier
BackupBackup and archival solutions that allow files and folders
to be backed-up and recovered from the cloud, and
provide off-site protection against data loss.
Backup and RecoveryBackup
Hybrid storageIntegrates on-premises IT environments with cloud
storage. Automates data management and storage, plus
supports disaster recovery.
Storage GatewayStorSimple
Bulk data transferA data transport solution that uses secure disks and
appliances to transfer substantial amounts of data.

Petabyte- to Exabyte-scale data transport solution.

AWS Import/Export Disk

AWS Import/Export Snowball

AWS Snowball Edge

AWS Snowmobile

Import/Export

Data Box

Disaster recoveryAutomates protection and replication of virtual
machines with health monitoring, recovery plans,
and recovery plan testing.
Site Recovery

For a more detailed understanding download the document here

Surprisingly, as per an article published by Gartner, “Cloud Computing is still perplexing to many CIOs even after a decade of cloud’. While cloud computing is a foundation for digital business, Gartner estimates that less than one-third of enterprises have a documented cloud strategy. This indeed comes as a surprise given the fact that cloud has evolved from a disruption to the indispensable tech of today and tomorrow, all along strategically adopted by many progressive companies.

In the same article Donna Scott, Vice President and distinguished analyst at Gartner states that “Cloud computing will become the dominant design style for new applications and for refactoring a large number of existing applications over the next 10-plus years”. She also added that “A cloud strategy clearly defines the business outcomes you seek, and how you are going to get there. Having a cloud strategy will enable you to apply its tenets quickly with fewer delays, thus speeding the arrival of your ultimate business outcomes.”

However, it is easier said than done. Many top businesses still have questions like how to make the most from cloud computing? What kind of architectures and techniques need to be strategized to support the many flavors of evolving cloud computing? Private or Public? Hybrid or Public? Azure or AWS, or it should be a hybrid combo?

Through a series of blogs we intent to bring answers to these questions. As a first one, we would like to highlight and represent a comparative cloud service map focusing on both Azure and AWS both leaders in public cloud platforms, as published by Microsoft.

The well-researched article draws detailed comparisons between Azure and AWS and how common cloud services across parameters such as Marketplace, Compute, Storage, Networking, Database, Analytics, Big Data, Intelligence, IOT, Mobile and Enterprise Integration are made available via Azure and Amazon Web Services (AWS)

It should be noted that as prominent public cloud platforms providers, Azure and AWS each offer businesses a wide and comprehensive capabilities across the globe. Many organizations have chosen either one of them or both depending upon their needs in order to gain more agility, and flexibility while minimizing the risk and maximizing the larger benefits of a multi-cloud environment.

For starters, let’s start with COMPUTE and the points one should consider and compare before deciding the Azure or AWS approach or a combination of both.

ServiceDescriptionAWSAzure
Virtual serversAllows users to deploy, manage, and maintain
OS and server software; instance types provide
configurations of CPU/RAM.

Offers a lightweight, simplified product offering users can
choose from from when building out a virtual machine.

Elastic Compute Cloud (EC2)
VMs

Amazon Lightsail

Virtual Machines

Virtual Machine Images

Container managementSupports Docker containers and allows users to run
applications on managed instance clusters.

Allows customers to store Docker formatted images. Used
to create all types of container deployments on Azure.

EC2 Container Service (ECS)

EC2 Container Registry

Container Service

Container Registry

Microservice-based
applications
Orchestrates and manages the execution, lifetime, and
resilience of complex, interrelated code components
that can be either stateless or stateful.
Service Fabric
Backend process logicIntegrates systems and runs backend processes
in response to events or schedules without
provisioning or managing servers.
LambdaFunctions

Event Grid

Job orchestrationWhen processing across hundreds or thousands
of compute nodes, this tool orchestrates the
tasks and interactions between compute
resources that are necessary.
AWS BatchBatch
ScalabilityAutomatically changes the number of instances
providing a compute workload. Users set defined
metrics and thresholds that determine if the platform
adds or removes instances.
AWS Auto ScalingVirtual Machine Scale Sets

App Service Scale Capability (PAAS)

AutoScaling

Pre-defined templatesCommunity-led templates for creating and
deploying virtual machine-based solutions.
AWS Quick StartQuickstart templates

For a more detailed understanding download the document here

Cloud based Video Analysis is an upcoming field that strives to solve and automate video analysis in real time or near real time. The engine that drives the solution is set of cloud based APIs supported by Cloud providers such as AWS, Azure, Google Cloud etc. These APIs are built on top of Computer Vision, Face Recognition and Object Tracking. All these APIs are REST based and take a video frame or set of frames and return a JSON document that summarizes the analysis result and the percentage of confidence. To achieve real time or near real time analysis the enterprise solution needs to address the following constraints:


  • Process streaming video input into smaller frame set and process them in parallel – This allows for efficient processing
  • Use advanced heuristics and machine learning to minimize calls to API – the cloud APIs for cognitive services are priced by the number of calls. And hence using heuristics to infer results based on Machine Learning will reduce overall cost.


Use-case solved:

The solution we built here streams a live video stream from a series of traffic cameras operating simultaneously and trying to find vehicles that are infringing red lights and vehicles that are pulled over curbs. We also filter out sensitive content from video if the frames match the criteria and need to be displayed on the User Interface.


Solution:

The streaming video is broken down into frame-set of 10 seconds. These frames are then queued up in a Azure Service Bus Queue. An Azure function then analyzes the frames for existence of objects using an open source Computer Vision library. The frames with no objects are not sent to Cognitive Services. We also do other heuristics and CV analysis to pre-determine if a call to Cloud API for cognitive services is needed at all. Once a frame-set is marked ready for cognitive services it is sent to a different Service Bus Queue. Another Azure function makes a call to cognitive services and gathers statistics of the frame set. Based on configurations, the azure function determines which frames are identified for the match and forwards them to another Service Bus Queue. A third azure function processes these frame-sets and blurs sensitive content on these frame-sets and stores them in Azure Blob Storage. The matched content can be viewed in a Node Js, Angular 2 based web application running in Azure Container Service.


Design:

realtime-video


Results & Conclusion:
  • Able to achieve real time analysis with minimal API cost
  • Able to scale horizontally for multiple video streams
  • Able to achieve multiple analysis objectives on video streams

CloudIQ is a leading Cloud Consulting and Solutions firm that helps businesses solve today’s problems and plan the enterprise of tomorrow by integrating intelligent cloud solutions. We help you leverage the technologies that make your people more productive, your infrastructure more intelligent, and your business more profitable. 

US

3520 NE Harrison Drive, Issaquah, WA, 98029

INDIA

Chennai One IT SEZ,

Module No:5-C, Phase ll, 2nd Floor, North Block, Pallavaram-Thoraipakkam 200 ft road, Thoraipakkam, Chennai – 600097


© 2024 CloudIQ Technologies. All rights reserved.

Get in touch

Please contact us using the form below

    USA

    3520 NE Harrison Drive, Issaquah, WA, 98029

    +1 (206) 203-4151

    INDIA

    Chennai One IT SEZ,

    Module No:5-C, Phase ll, 2nd Floor, North Block, Pallavaram-Thoraipakkam 200 ft road, Thoraipakkam, Chennai – 600097

    +91-044-43548317