Building a unified monitoring dashboard with Azure Alerts – A QuickStart Guide
As one of the most popular cloud platforms, Microsoft Azure is the backbone of thousands of businesses – 80% of the Fortune 500 companies are on Microsoft cloud, and Azure holds 31% of the global cloud market!
Microsoft’s customer-centricity shines through the entire Azure stack, and a critical part of it is the Azure Alerts that allows you to monitor the metrics and log data for the whole stack across your infrastructure, application, and Azure platform.
Azure Alerts offers organizations and IT managers, access to faster alerts and a unified monitoring platform. Once set up, the software requires minimal technical effort and gives the IT team a centralized monitoring experience through a single dashboard that manages ALL the alerts.
The platform is designed to provide low latency log alerts and metric alerts which gives IT managers the opportunity to identify and fix production and performance issues almost in real-time. Naturally, in complex IT environments, this level of control and overview of the IT infrastructure leads to higher productivity and reduced costs.
Here are more details of how Azure Alerts work
Alerts proactively notify us when important conditions are found in your monitoring data. They allow us to identify and address issues before the users notice them.
This diagram represents the flow of alerts
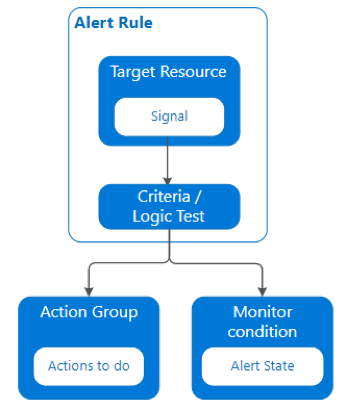
Alerts can be created from
- Metric values of resources
- Log search queries results
- Activity log events
- Health of the underlying Azure platform
This is what a typical alert dashboard for a single/multiple subscriptions looks like
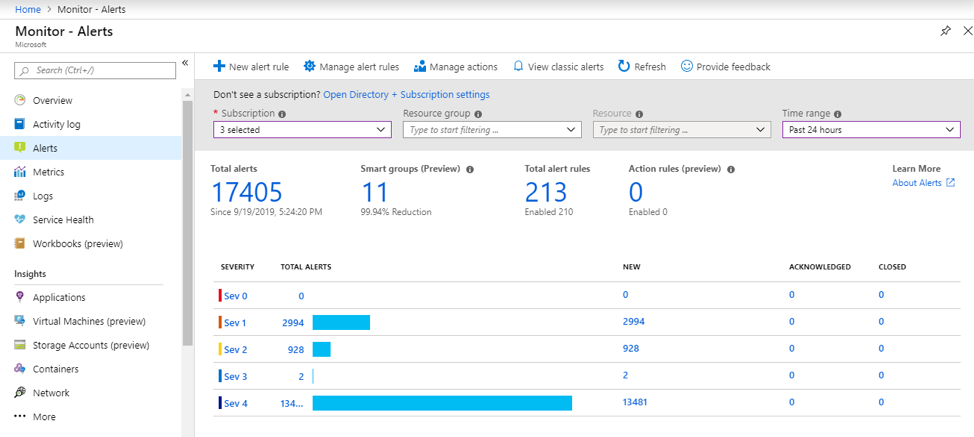
You can see 5 entities on the dashboard
- Severity
- Defines how severe the alert is and how quickly action needs to be taken.
- Total alerts
- Total number of alerts received aggregated by the severity of the alert.
- New
- The issue has just been detected and hasn’t yet been reviewed.
- Acknowledged
- An administrator has reviewed the alert and started working on it.
- Closed
- The issue has been resolved. After an alert has been closed, you can reopen it by changing it to another state.
We will now take you through the steps to create Metric Alerts, Log Search Query Alerts, Activity Log Alerts, and Service Health Alerts.
STEPS TO CREATE A METRIC ALERT
Go to Azure monitor. Click ‘alerts’ found on the left side.
To create a new alert, click on the ‘+ New alert rule’.
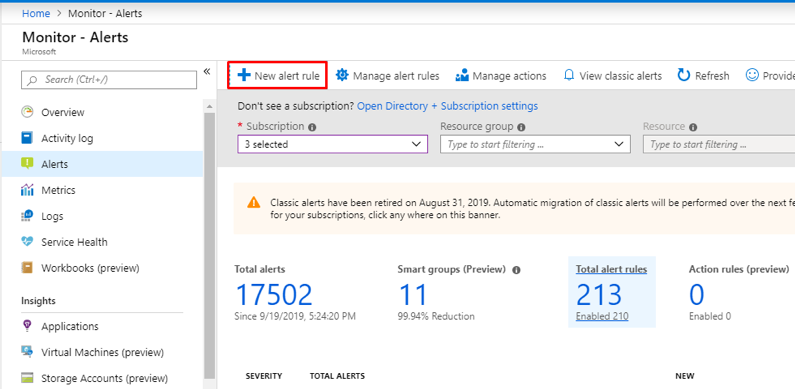
After clicking ‘+ New alert rule’ this window will appear.
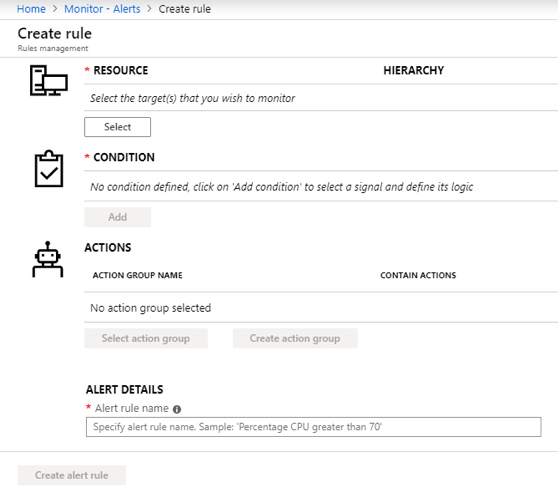
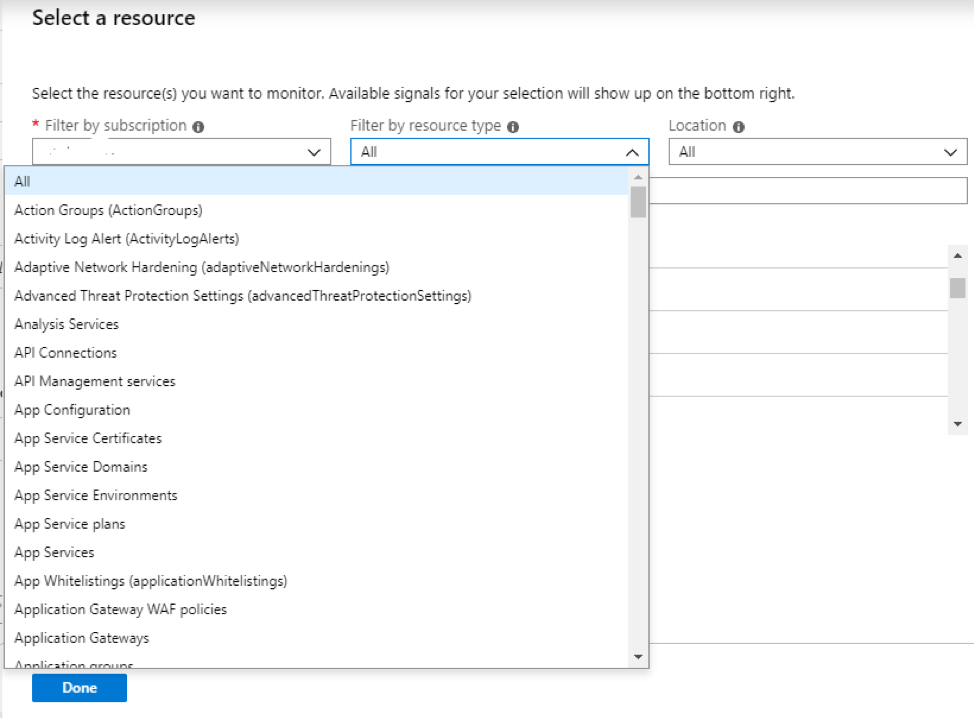
To select a resource, click ‘select’. It will display this window where you can select the resource by filtering the subscription, and resource type and the location of the resource. Then select ‘Done’ in the bottom.
Once the resource is selected, now configure the condition. Click ‘select’ to configure the signal. The signal type will show both metrics and activity log for the selected resource.
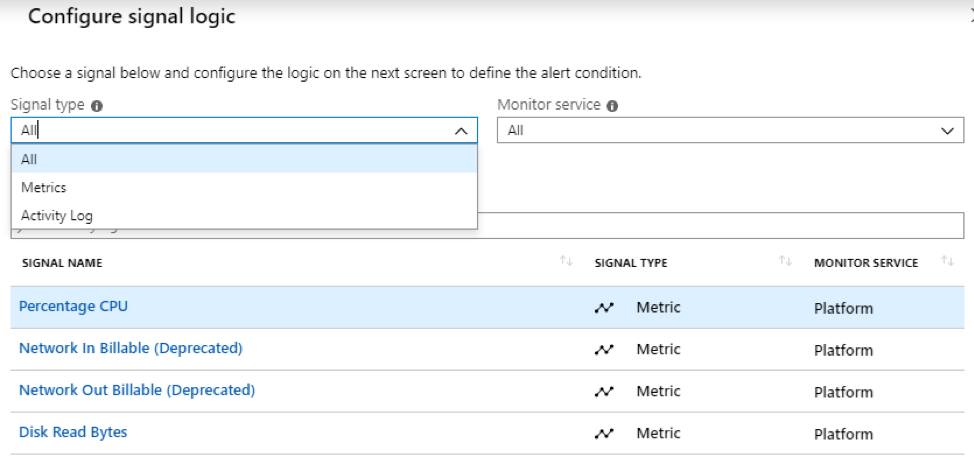
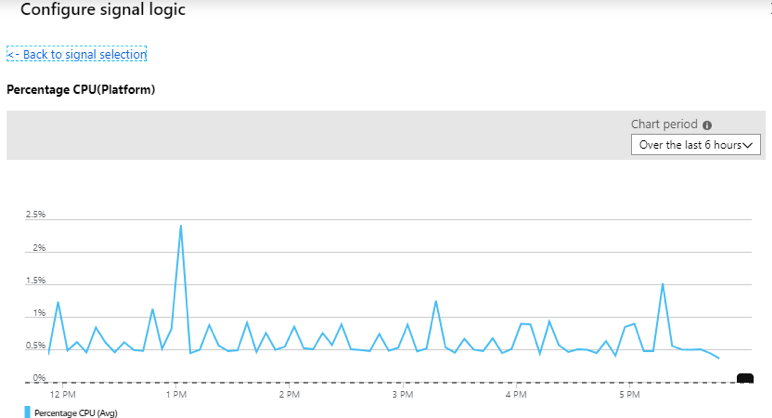
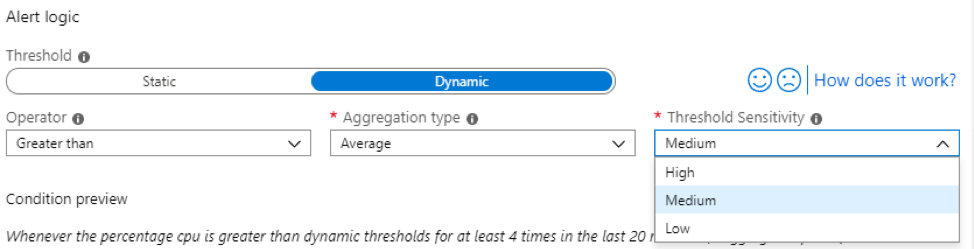
Select the signal for which you need to create the alert, after selecting the signal, a new consecutive window is displayed, where you need to describe the alert logic.
Set the threshold sensitivity above which you need to trigger the alert. Setting the threshold sensitivity is applicable for static threshold only.
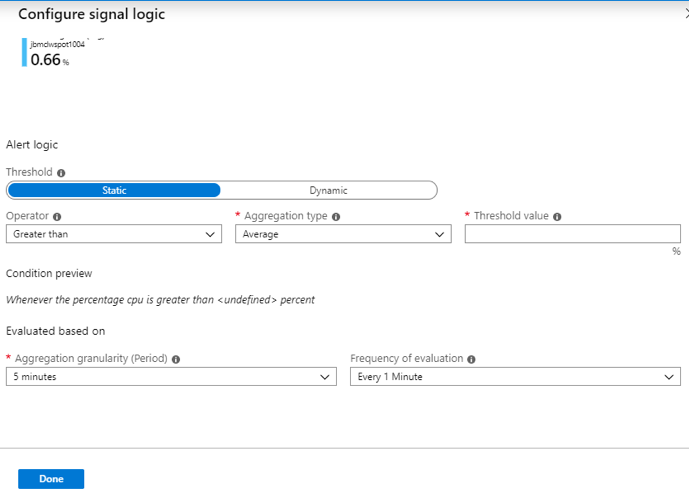
For dynamic threshold, the value is determined by continuously learning the data of the metric series and trying to model it using a set of algorithms and methods. It detects patterns in the data such as seasonality (Hourly / Daily / Weekly) and can handle noisy metrics (such as machine CPU or memory) as well as metrics with low dispersion (such as availability and error rate).
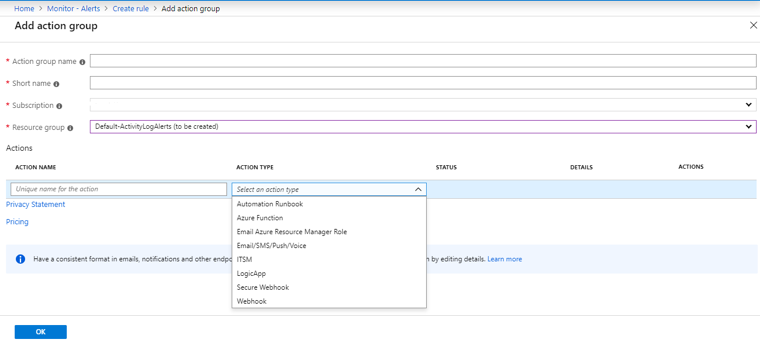
Now select an ‘action group’ if you already have one or create a new action group.
- Provide a name for the action group.
- Select the subscription and resource group where the action group needs to be deployed.
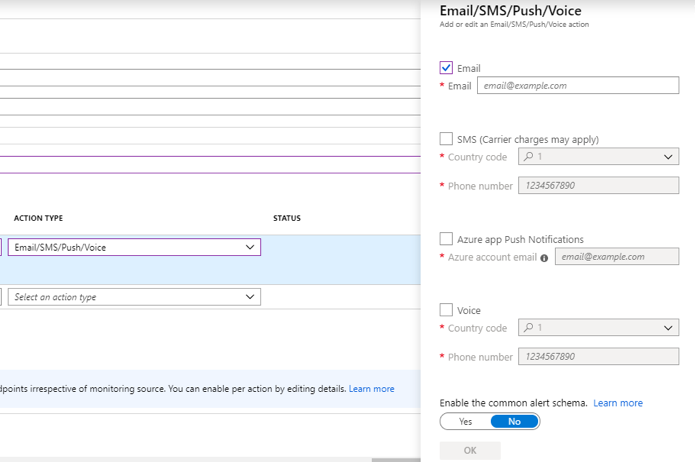
- If you have selected the action type as Email/SMS/Push/Voice, that will display another window to configure the necessary details like email ID, contact number for SMS and voice notifications, etc., provide the information and select OK.
- You can see the different action types available in the image below.
Input the alert details, alert rule name, description of the alert, and severity of the rule. Select ‘enable rule upon creation’.
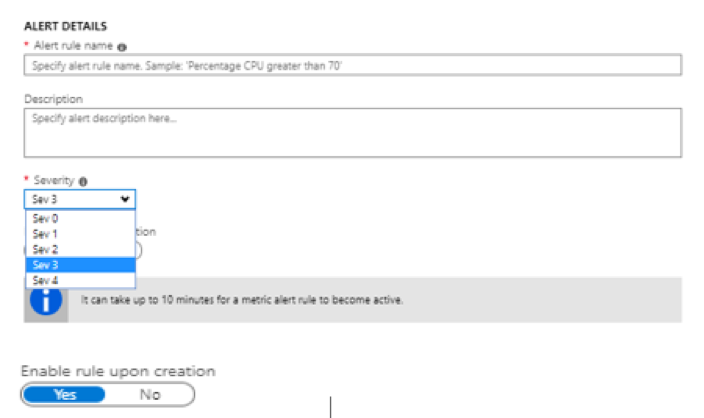
Finally click ‘create alert rule’. It might take some time to create the alert and for it to start working.
HOW TO CREATE LOG SEARCH QUERY ALERTS
Repeat steps 1 to 3 as outlined in the Metric alert creation. In step 3 select the resource type as “log analytics workspace”.
Now select the condition, you can choose the “Log (saved query)” or select “Custom log search”.
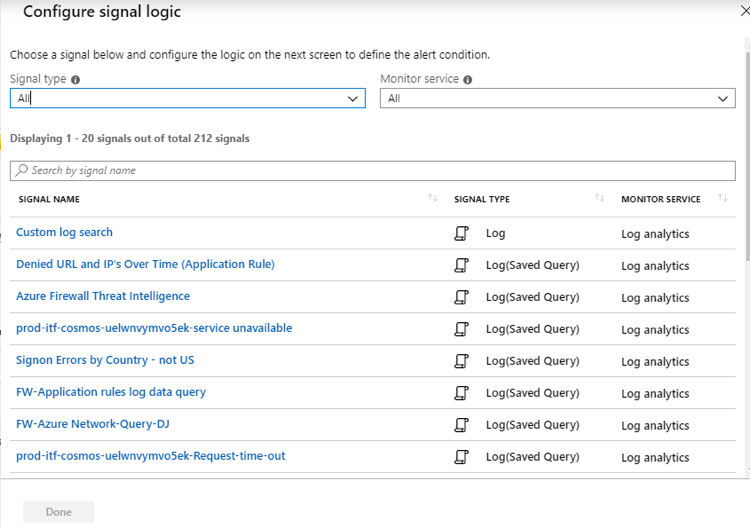
Select the signal name as per your requirements; a new signal window will be displayed containing the attributes corresponding to the selected signal.
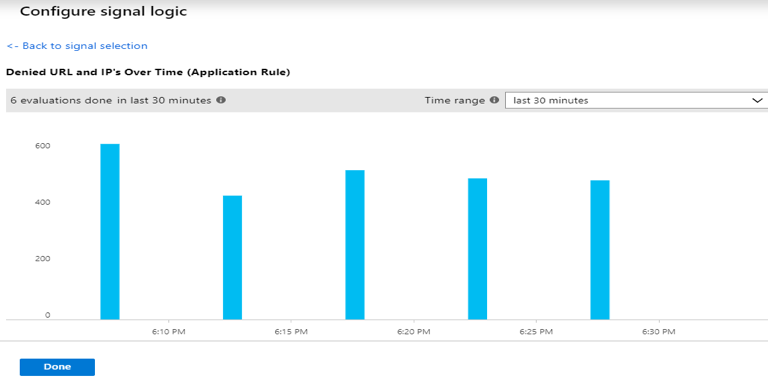
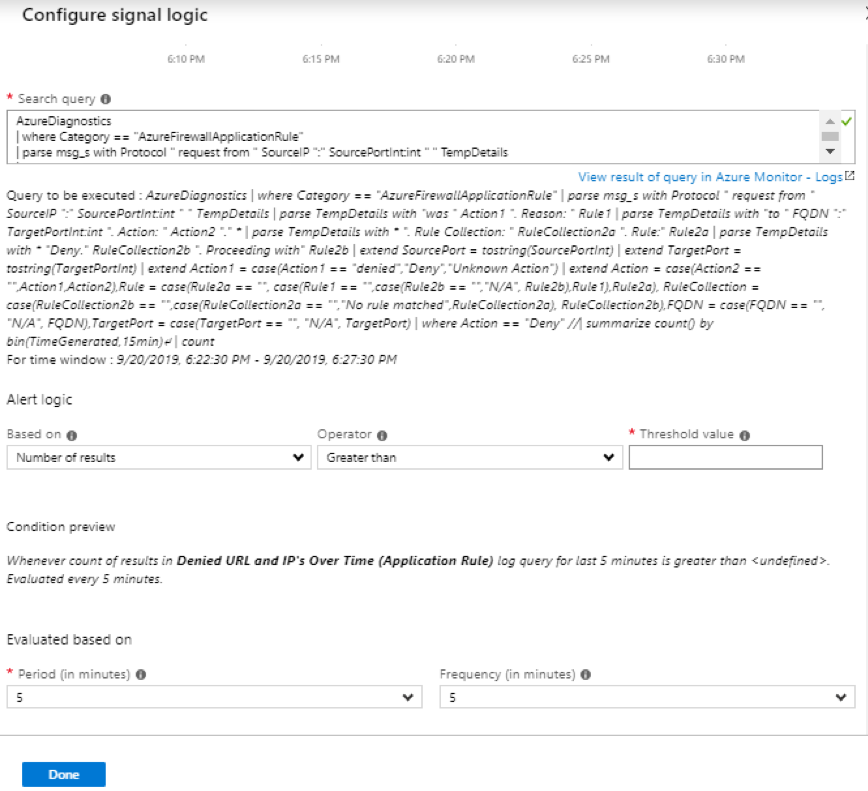
Here we have selected a saved query, which provides the result shown as above.
- Rule created based on “Number of results” and the threshold provided
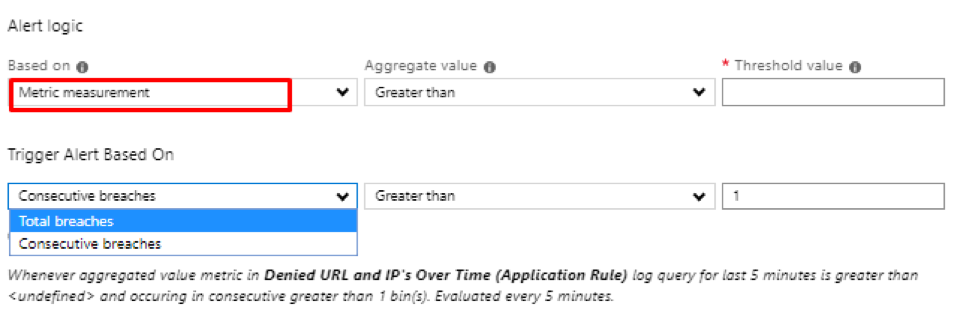
- Metric measurement and the threshold provided. The Trigger alert based on,
- Total breaches or
- Continuous breaches of the threshold provided in the metric measurement.
Provide the evaluation based on time and the frequency in minutes where the alert rule needs to be monitored.
Follow the steps 8 and 9 as outlined in the Metric alert creation.
STEPS TO CREATE ACTIVITY LOG ALERTS
Repeat steps 1 to 3 as outlined in the Metric alert creation. In step 3 select the resource type as “log analytics workspace”.
On selecting the condition, click ‘Monitor Service’ and select the activity log-Administrative.
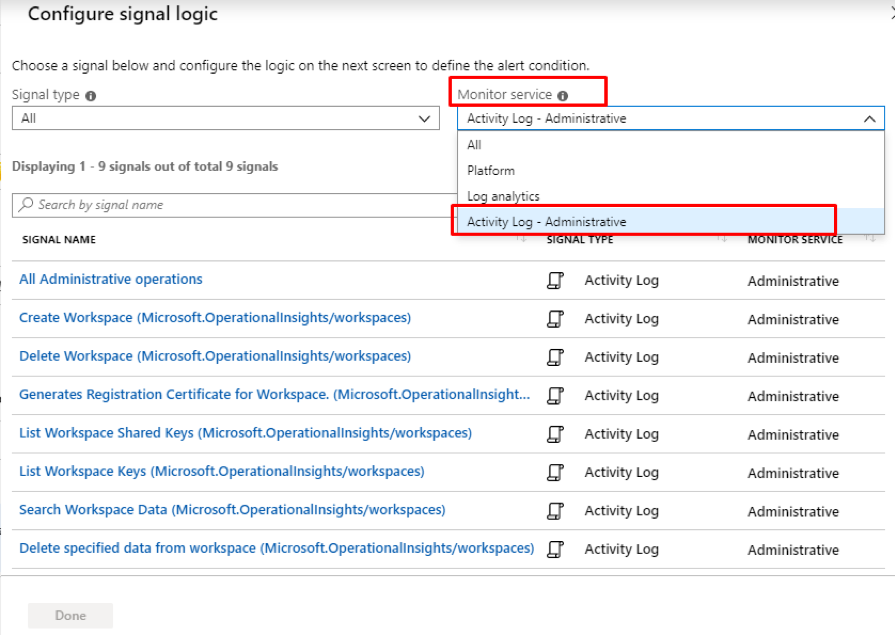
Here we have selected, all administrative operations as the signal.
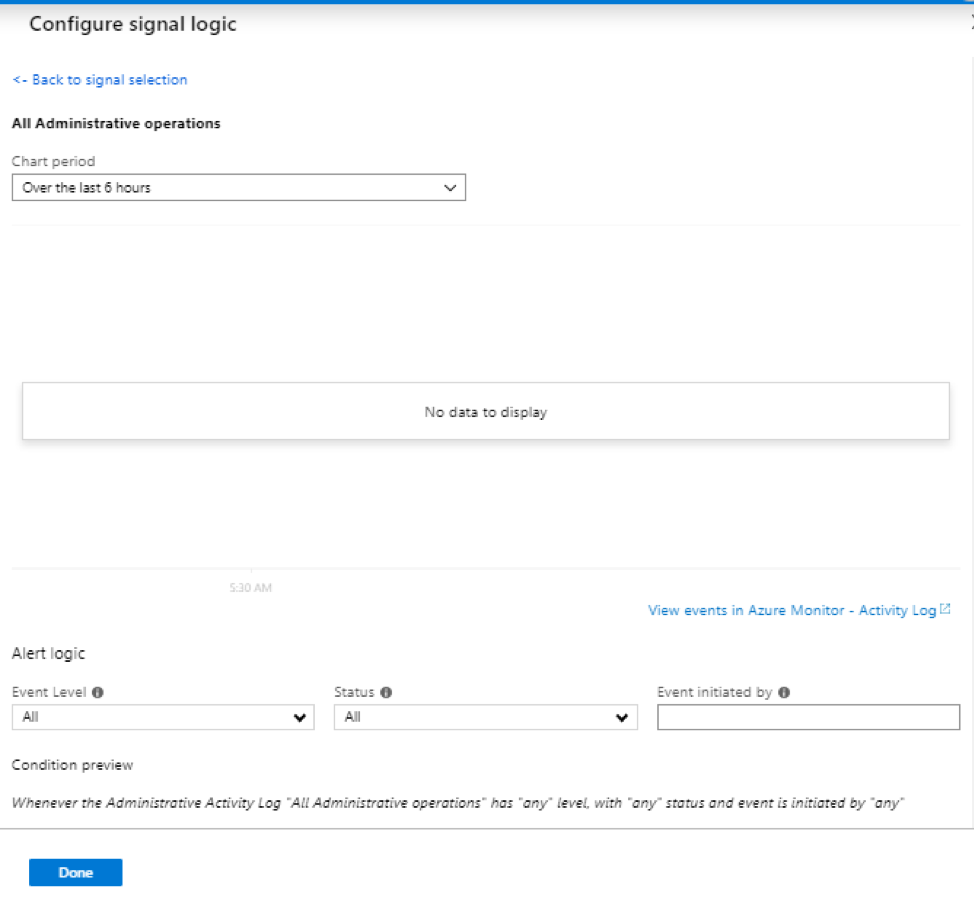
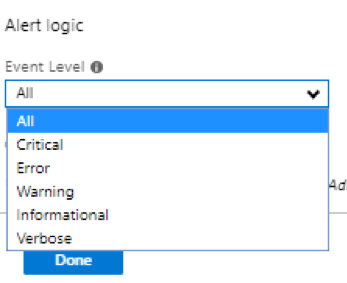
Now configure the alert logic. The event level has many types. Select as per your requirement and click Done in the bottom.
Follow the steps 8 and 9 as outlined in the Metric alert creation.
STEPS TO CREATE A SERVICE HEALTH ALERT
You can receive an alert when Azure sends service health notifications to your Azure subscription. You can configure the alert based on:
- The class of service health notification (Service issues, Planned maintenance, Health advisories).
- The subscription affected.
- The service(s) affected.
- The region(s) affected.
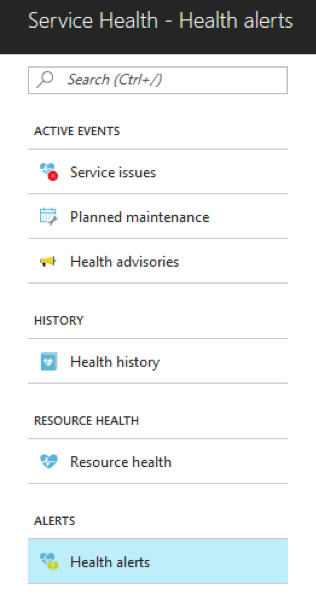
Login into Azure portal, search for service health if it is on the left side. Click service health.
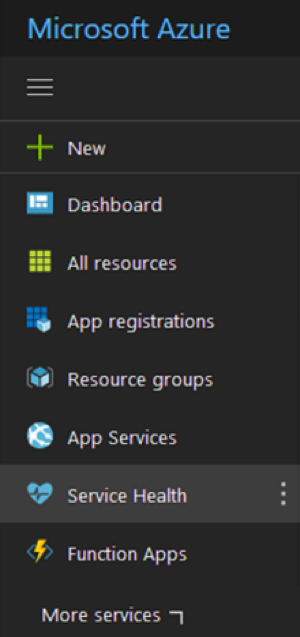
You can see the service health service is now visible and select the “Health alerts” in the alerts section.
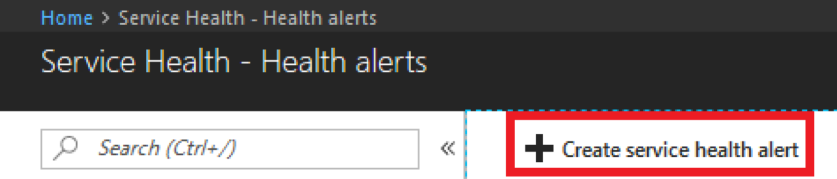
Select Create service health alert and fill in the fields.
Select the subscription and services for which you need to be alerted.
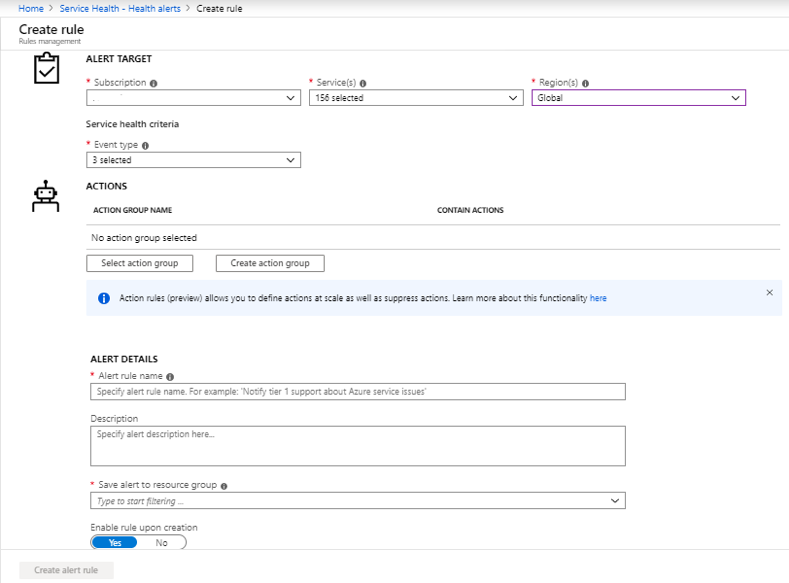
Select the ‘region’ where your resources are located and select the ‘Event type’. Azure provides the following event types,
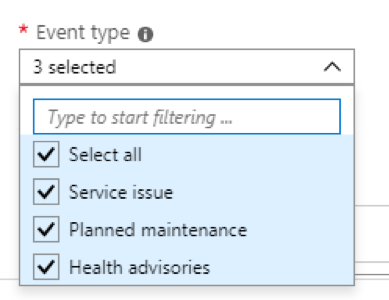
Select “all the event types” so that you can receive alerts irrespective of the event type.
Follow the steps 8 and 9 as outlined in the Metric alert creation. Then click on ‘Create Alert rule’. The service health alert can be seen in the Health Alerts section.
Share this:
CloudIQ is a leading Cloud Consulting and Solutions firm that helps businesses solve today’s problems and plan the enterprise of tomorrow by integrating intelligent cloud solutions. We help you leverage the technologies that make your people more productive, your infrastructure more intelligent, and your business more profitable.
LATEST THINKING
INDIA
Chennai One IT SEZ,
Module No:5-C, Phase ll, 2nd Floor, North Block, Pallavaram-Thoraipakkam 200 ft road, Thoraipakkam, Chennai – 600097
© 2023 CloudIQ Technologies. All rights reserved.